The Physical Structure and Evolution of Transition Region Explosive Events Observed with ESIS

MSU solar physics research group · September 29, 2026 · the slides as they were presented, with the animations playing rather than frozen

Roy T. Smart,

Charles C. Kankelborg,

and Jacob D. Parker

Montana State University

The Physical Structure and Evolution of Transition Region Explosive Events Observed with ESIS

1 / 51

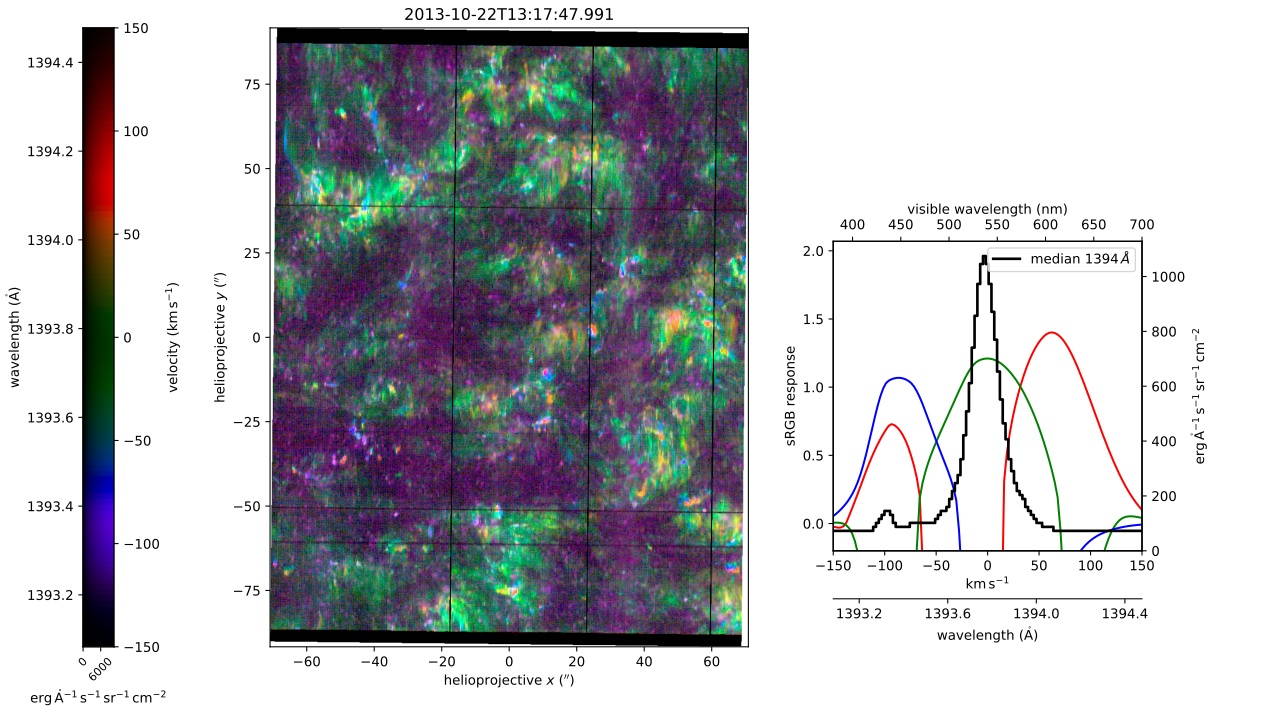
Interface Region Imaging Spectrograph (IRIS) Si IV 1394 A
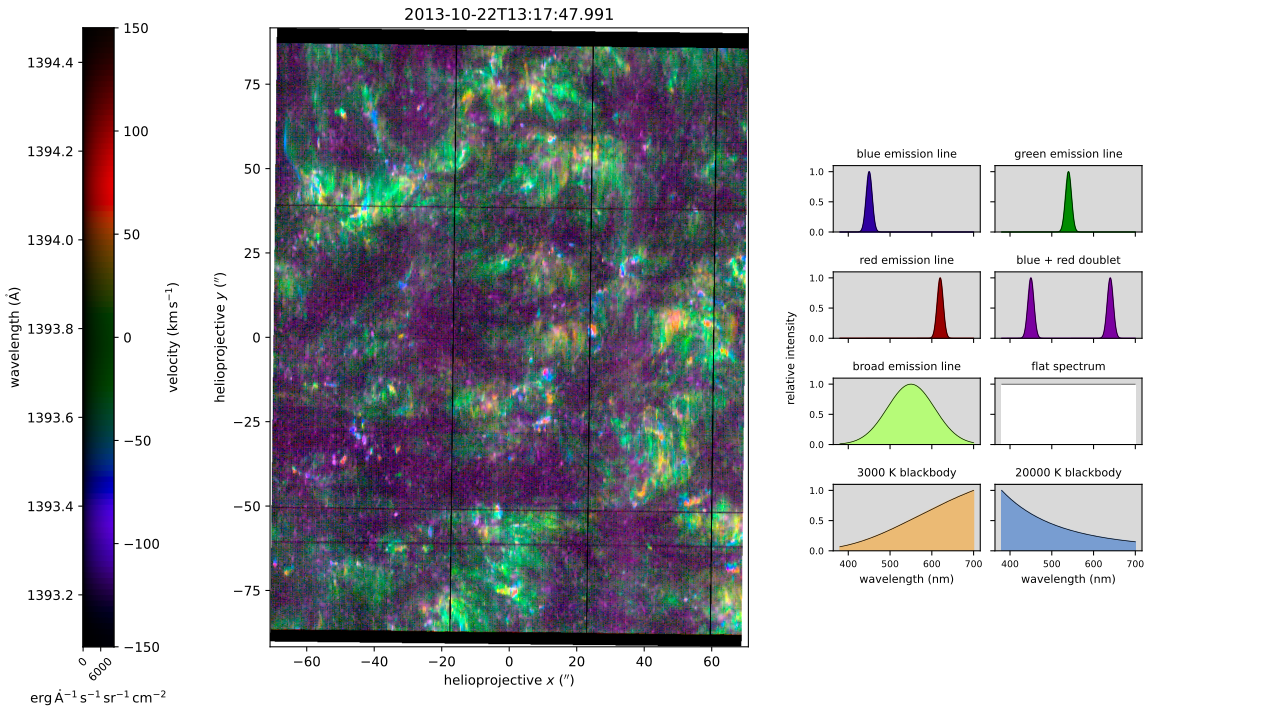
2 / 51

Interface Region Imaging Spectrograph (IRIS) Si IV 1394 A
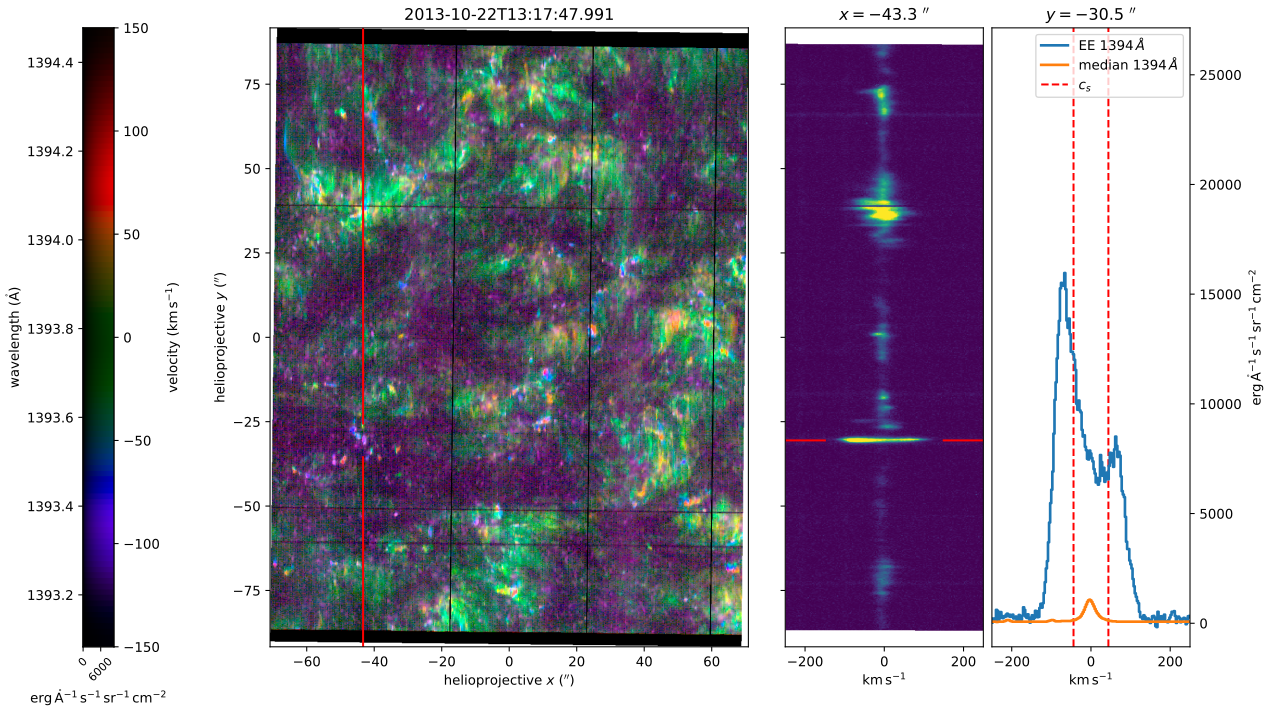
3 / 51
4 / 51
5 / 51
6 / 51
7 / 51

ESIS Inversions

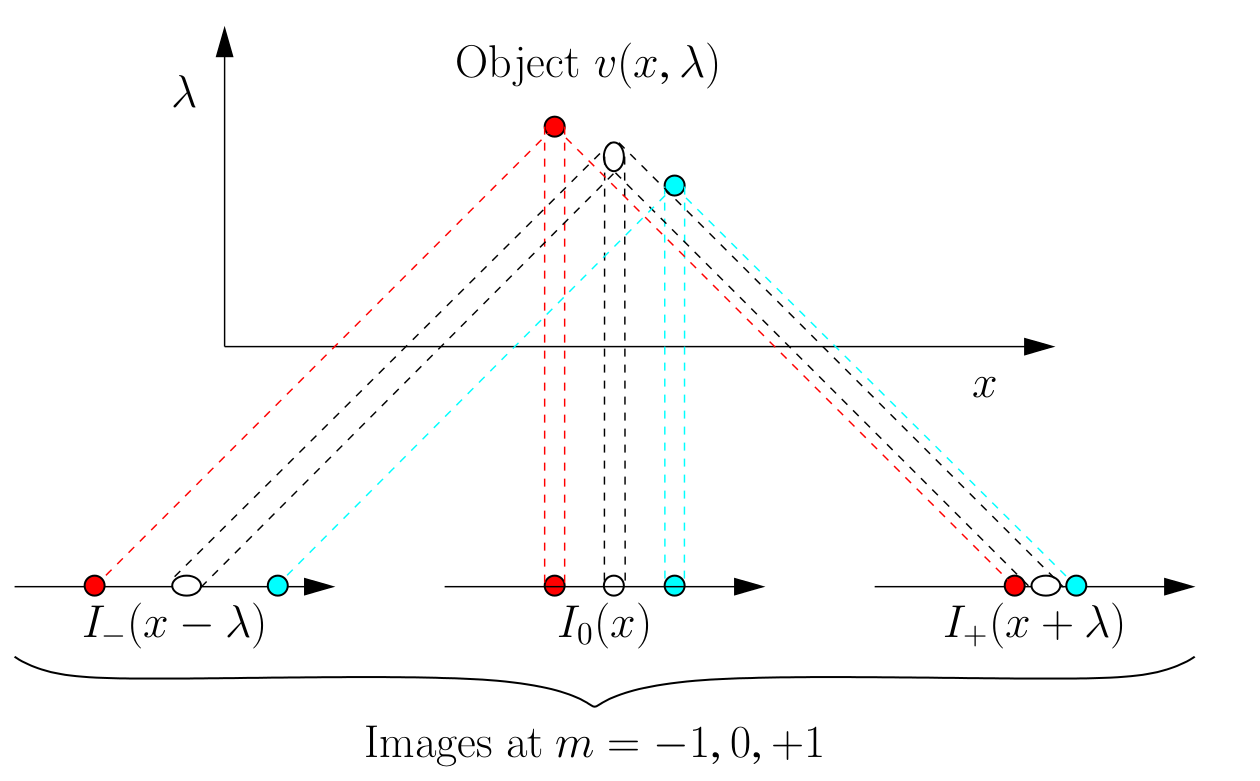
Computed tomography (CT)

Spatial/spectral ambiguity

Limited number of angles

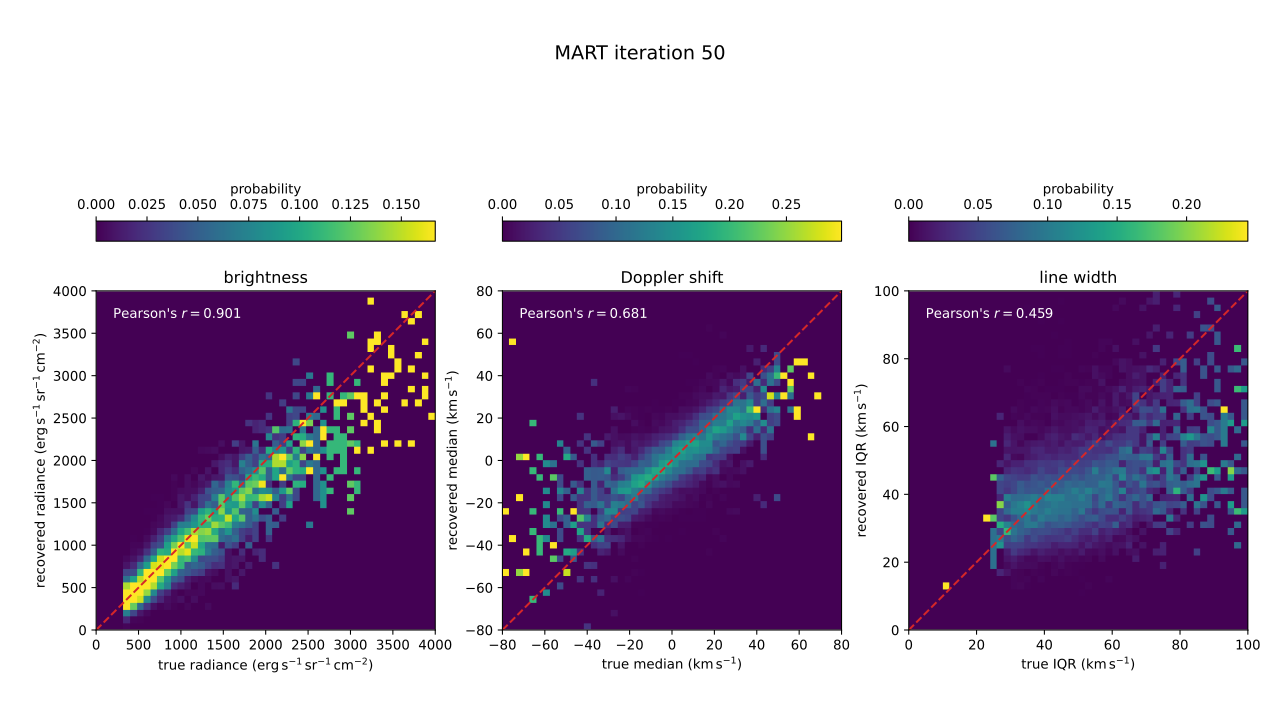
Multiplicative algebraic reconstruction technique (MART)

8 / 51
9 / 51
10 / 51
11 / 51
12 / 51
13 / 51
14 / 51

O V 630 A

15 / 51

Event E

16 / 51

Event E

17 / 51

Event E

18 / 51

Event E

19 / 51

Event E

20 / 51

Event E

21 / 51

Event E

22 / 51
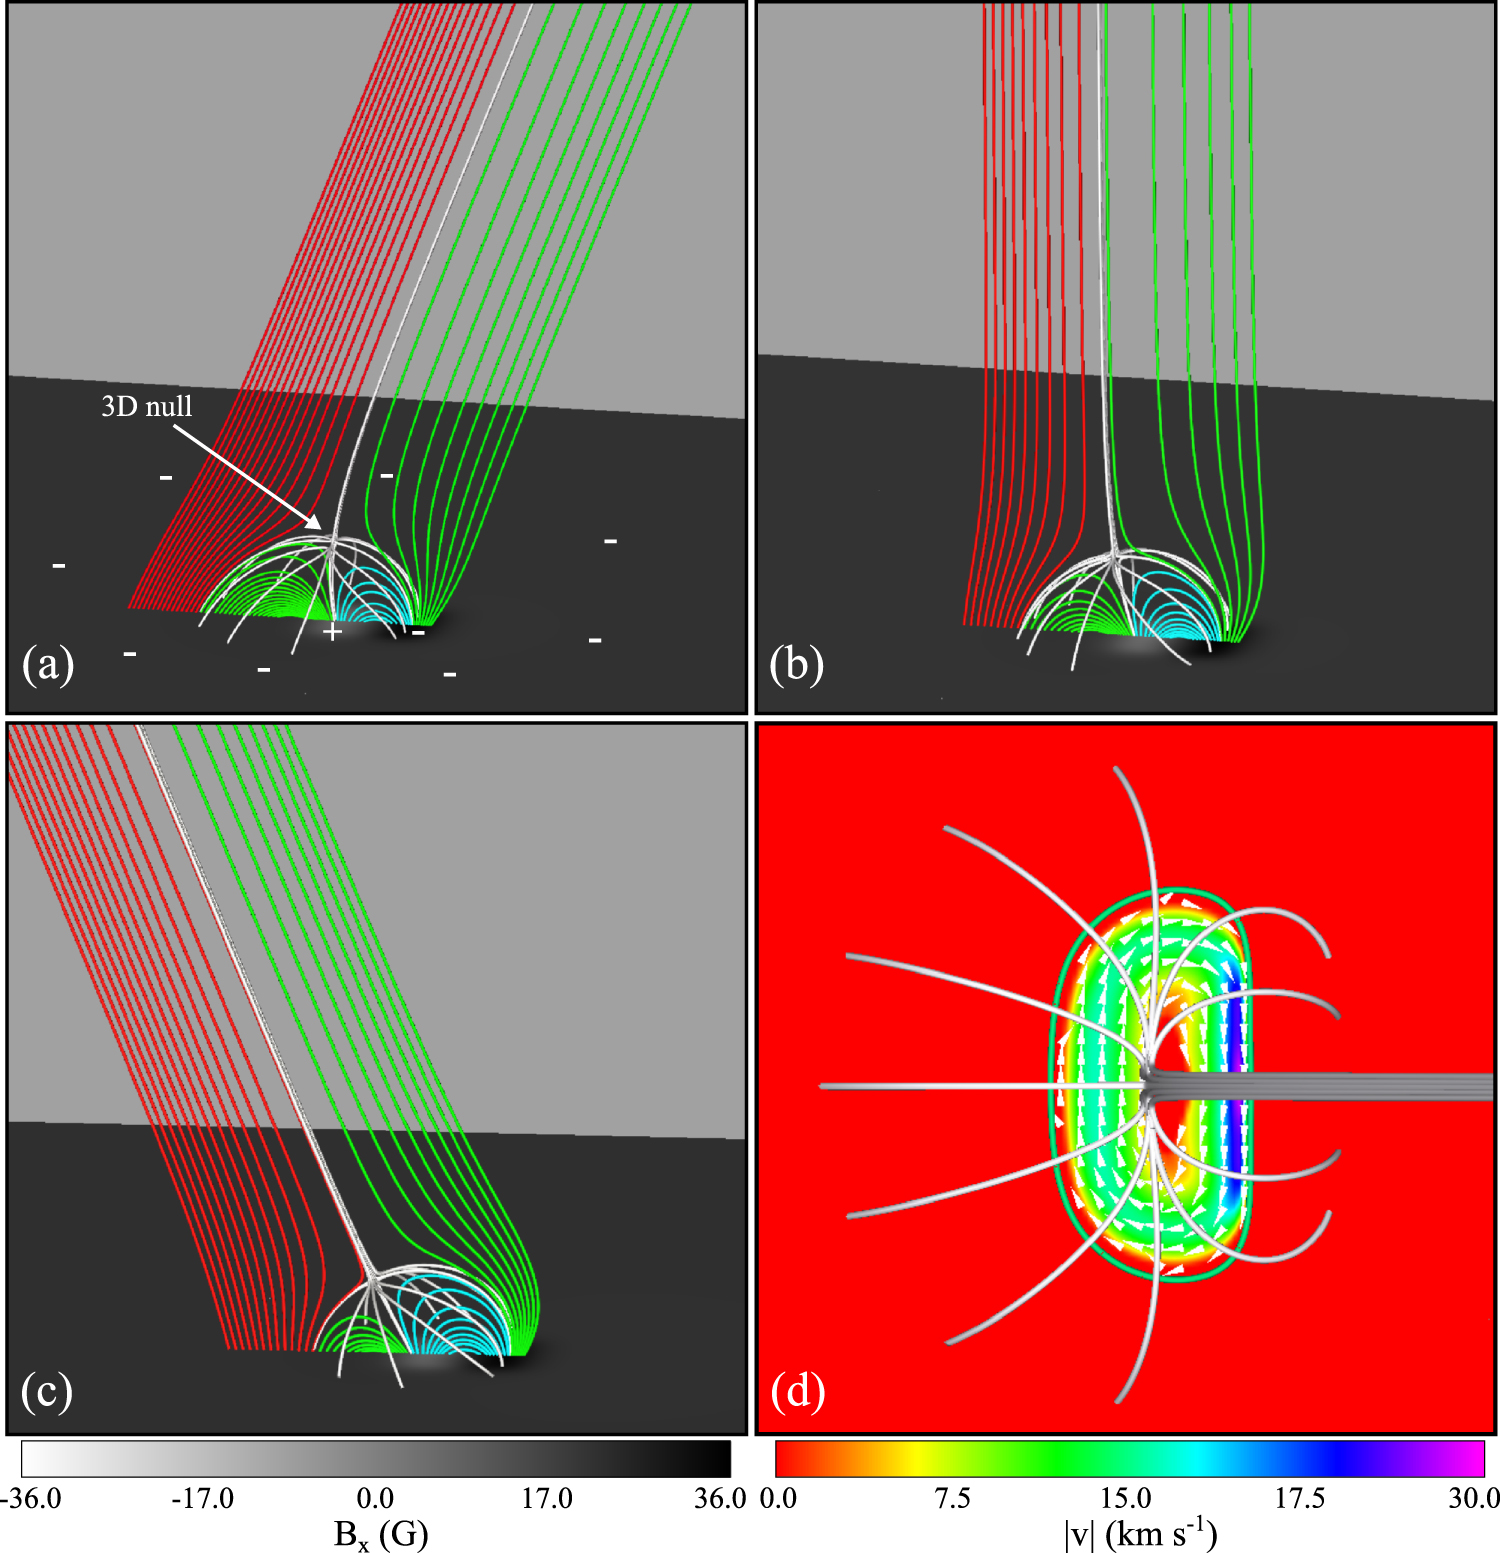
Figure 2 of Wyper et al. (2018)

Figure 2. The initial potential magnetic field in the three simulations with background-field tilt angles (a) θ = +22°, (b) θ = 0°, and (c) θ = −22°. The field is comprised of the domed fan plane and spine lines (silver field lines) of a 3D coronal null point above the parasitic polarity of a bipolar photospheric flux distribution. (d) Driving flows tangential to the photospheric boundary follow the contours of the positive parasitic polarity and are shown for θ = +22°. Note the increased flow speed near the polarity inversion line (green contour of Bx = 0) in the centre of the bipolar distribution.

Wyper et al. (2018)
23 / 51

Wyper et al. (2018)

Simulation

Ideal MHD (ARMS) on an adaptively refined grid

No gravity, conduction, or radiation, so no synthetic emission

Dome 24 Mm across, null 7–8 Mm up

34 G parasitic polarity in a 2 G open field

Uniform 1.2 MK corona, β ≈ 0.2

cs ≈ 130 km/s, vA ≈ 300 km/s

Filament channel sheared by 30 km/s flows for 20–30 min

Jet 150–300 km/s for 6–12 min, 1028 erg of kinetic energy

Scaled to L = 4 Mm, B = 2 G, ρ = 4 × 10−16 g cm−3

24 / 51
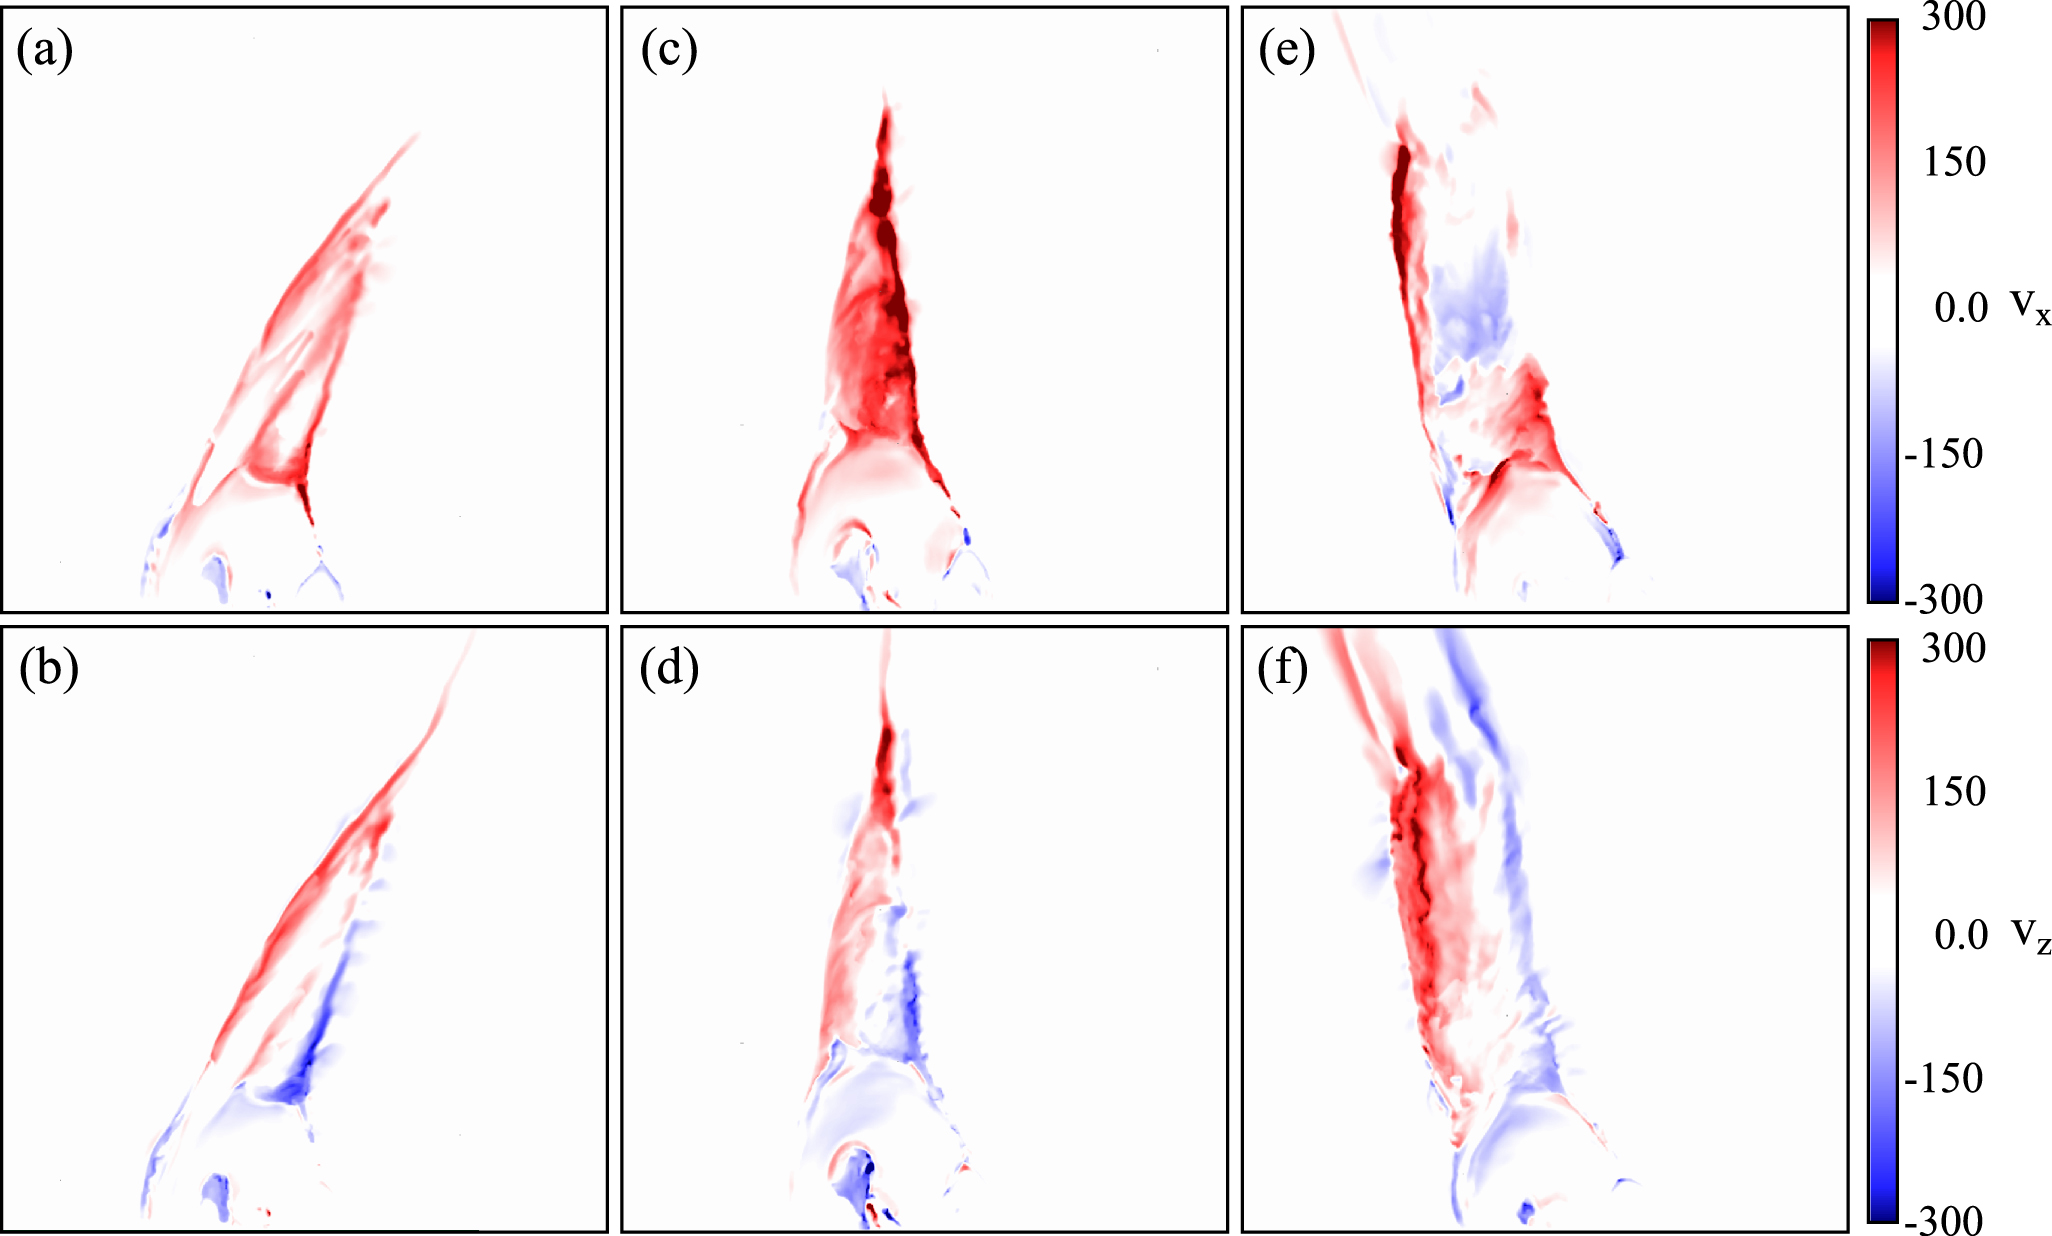
Figure 10 of Wyper et al. (2018)

Figure 10. vx (top) and vz (bottom) in the z = 0 plane as the jet is launched. Left column: θ = +22°, t = 31 minutes 20 s; middle column: θ = 0°, t = 54 minutes 20 s; right column: θ = −22°, t = 40 minutes. All velocities are in km s−1.

Wyper et al. (2018)

25 / 51

Event at

47″, −299″

26 / 51

Event at

47″, −299″

27 / 51

Event at 47″, −299″

28 / 51

Event at 47″, −299″

29 / 51

Event at 47″, −299″

30 / 51

Event at 47″, −299″

31 / 51

Figure 5. Plots of the Ca signal (upper left), density (upper right), field-aligned velocity (lower left), and temperature with magnetic field lines (lower right) in the case with transition region null points and piston driver. The elapsed time is 226 s. Reconnection is producing a butterfly-shaped, vertically oriented heated region and jet on the left, and a hot TR jet on the right.

Heggland et al. (2009)

32 / 51

Event at

150″, −200″

33 / 51

Event at

150″, −200″

34 / 51

Event at 150″, −200″

35 / 51

Event at 150″, −200″

36 / 51

Event at 150″, −200″

37 / 51

Event at 150″, −200″

38 / 51

Event C

39 / 51

Event C

40 / 51

Event C

41 / 51

Event C

42 / 51

Event C

43 / 51

Event C

44 / 51

Event D

45 / 51

Event D

46 / 51

Event D

47 / 51

Event D

48 / 51

Event D

49 / 51

Event D

50 / 51

Conclusions and Future Work

MART can be used to invert multiple lines within the ESIS passband

Fastest Doppler shift in Event E is about 60 km/s

Event E is a dynamic structure reminiscent of a minifilament eruption or jet.

We will continue to improve inversions (regularization, machine learning, etc.)

Statistical study of all the events in the passband

51 / 51