False-color IRIS Spectroheliogram
Si IV 1394 A
320-step dense raster
50 minutes per frame
Good FOV, but not temporally resolved
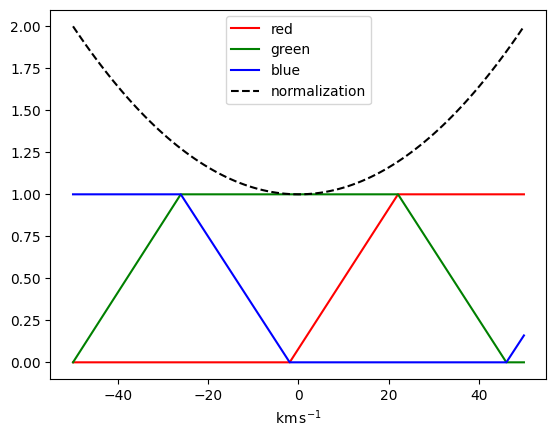
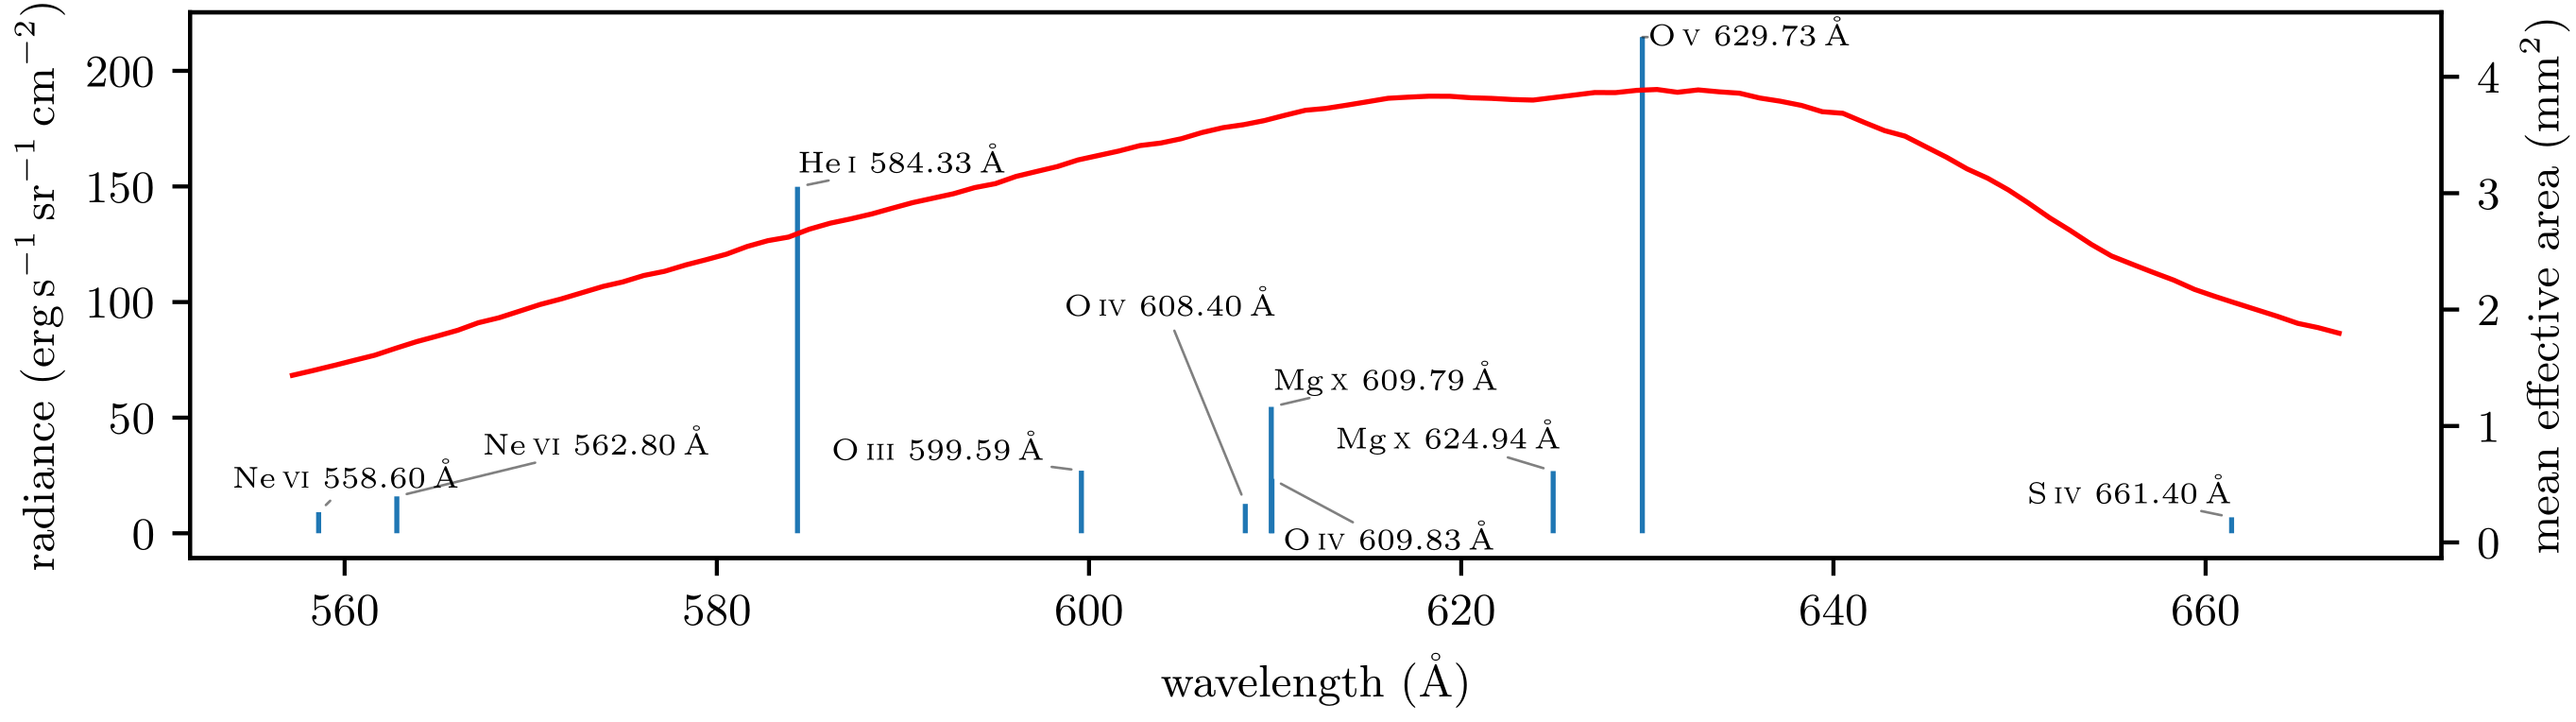
The EUV Snapshot Imaging Spectrograph (ESIS)
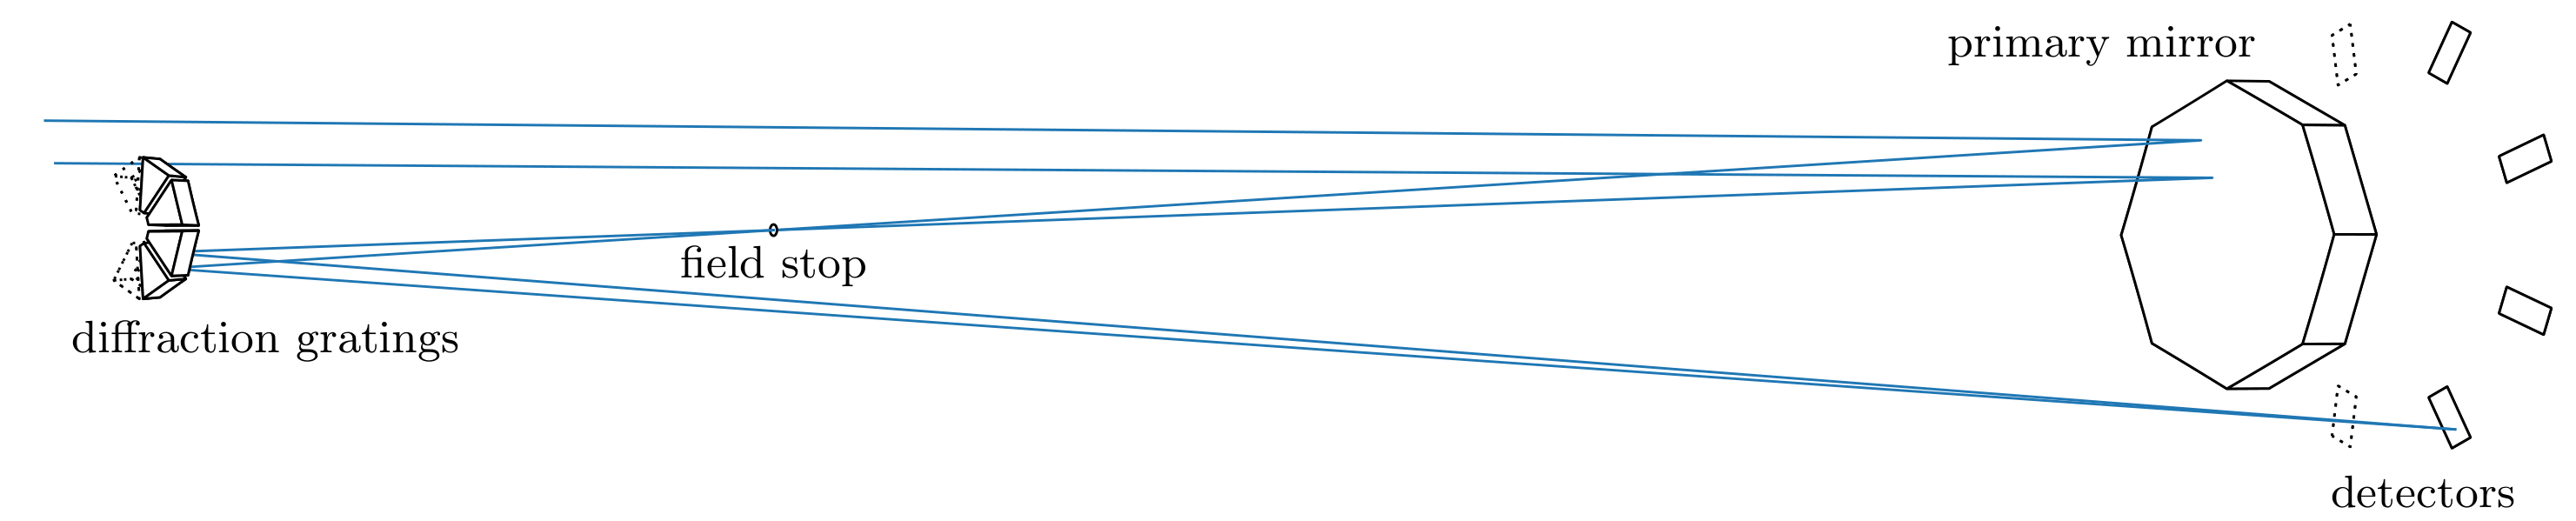
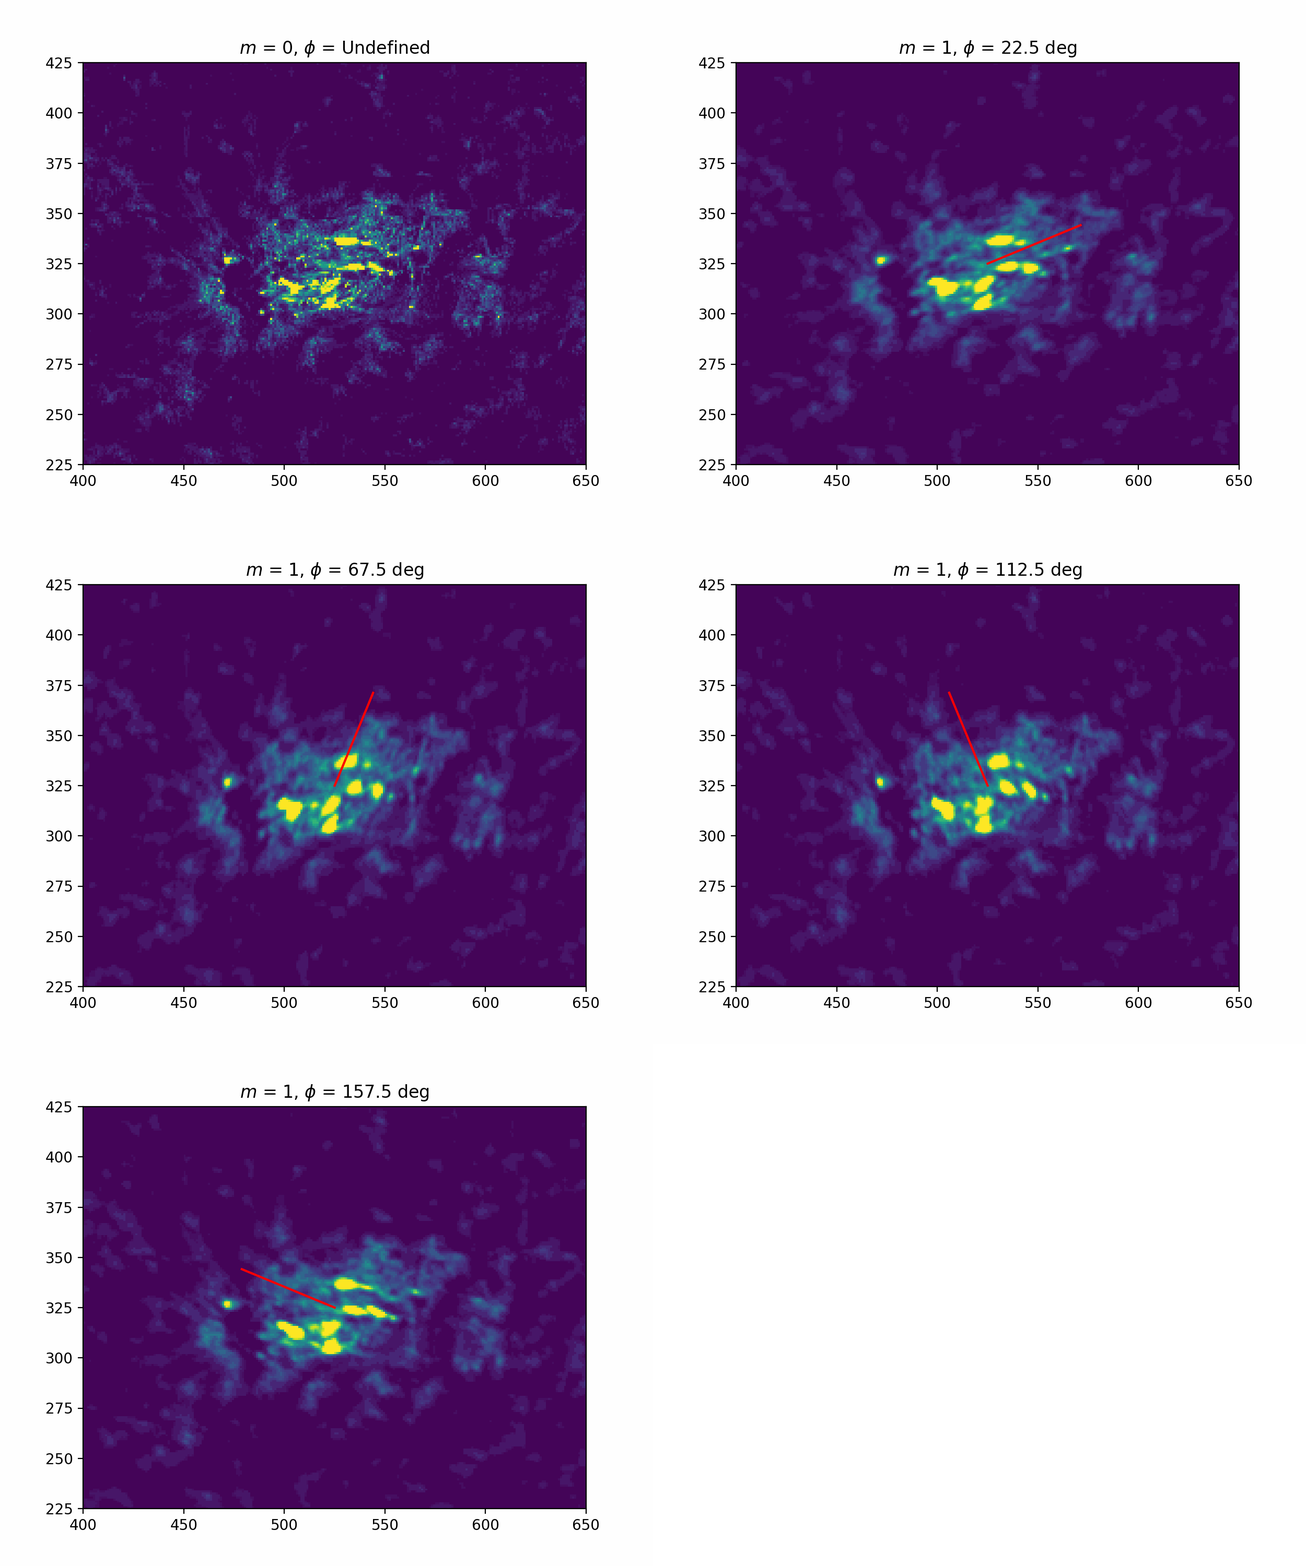
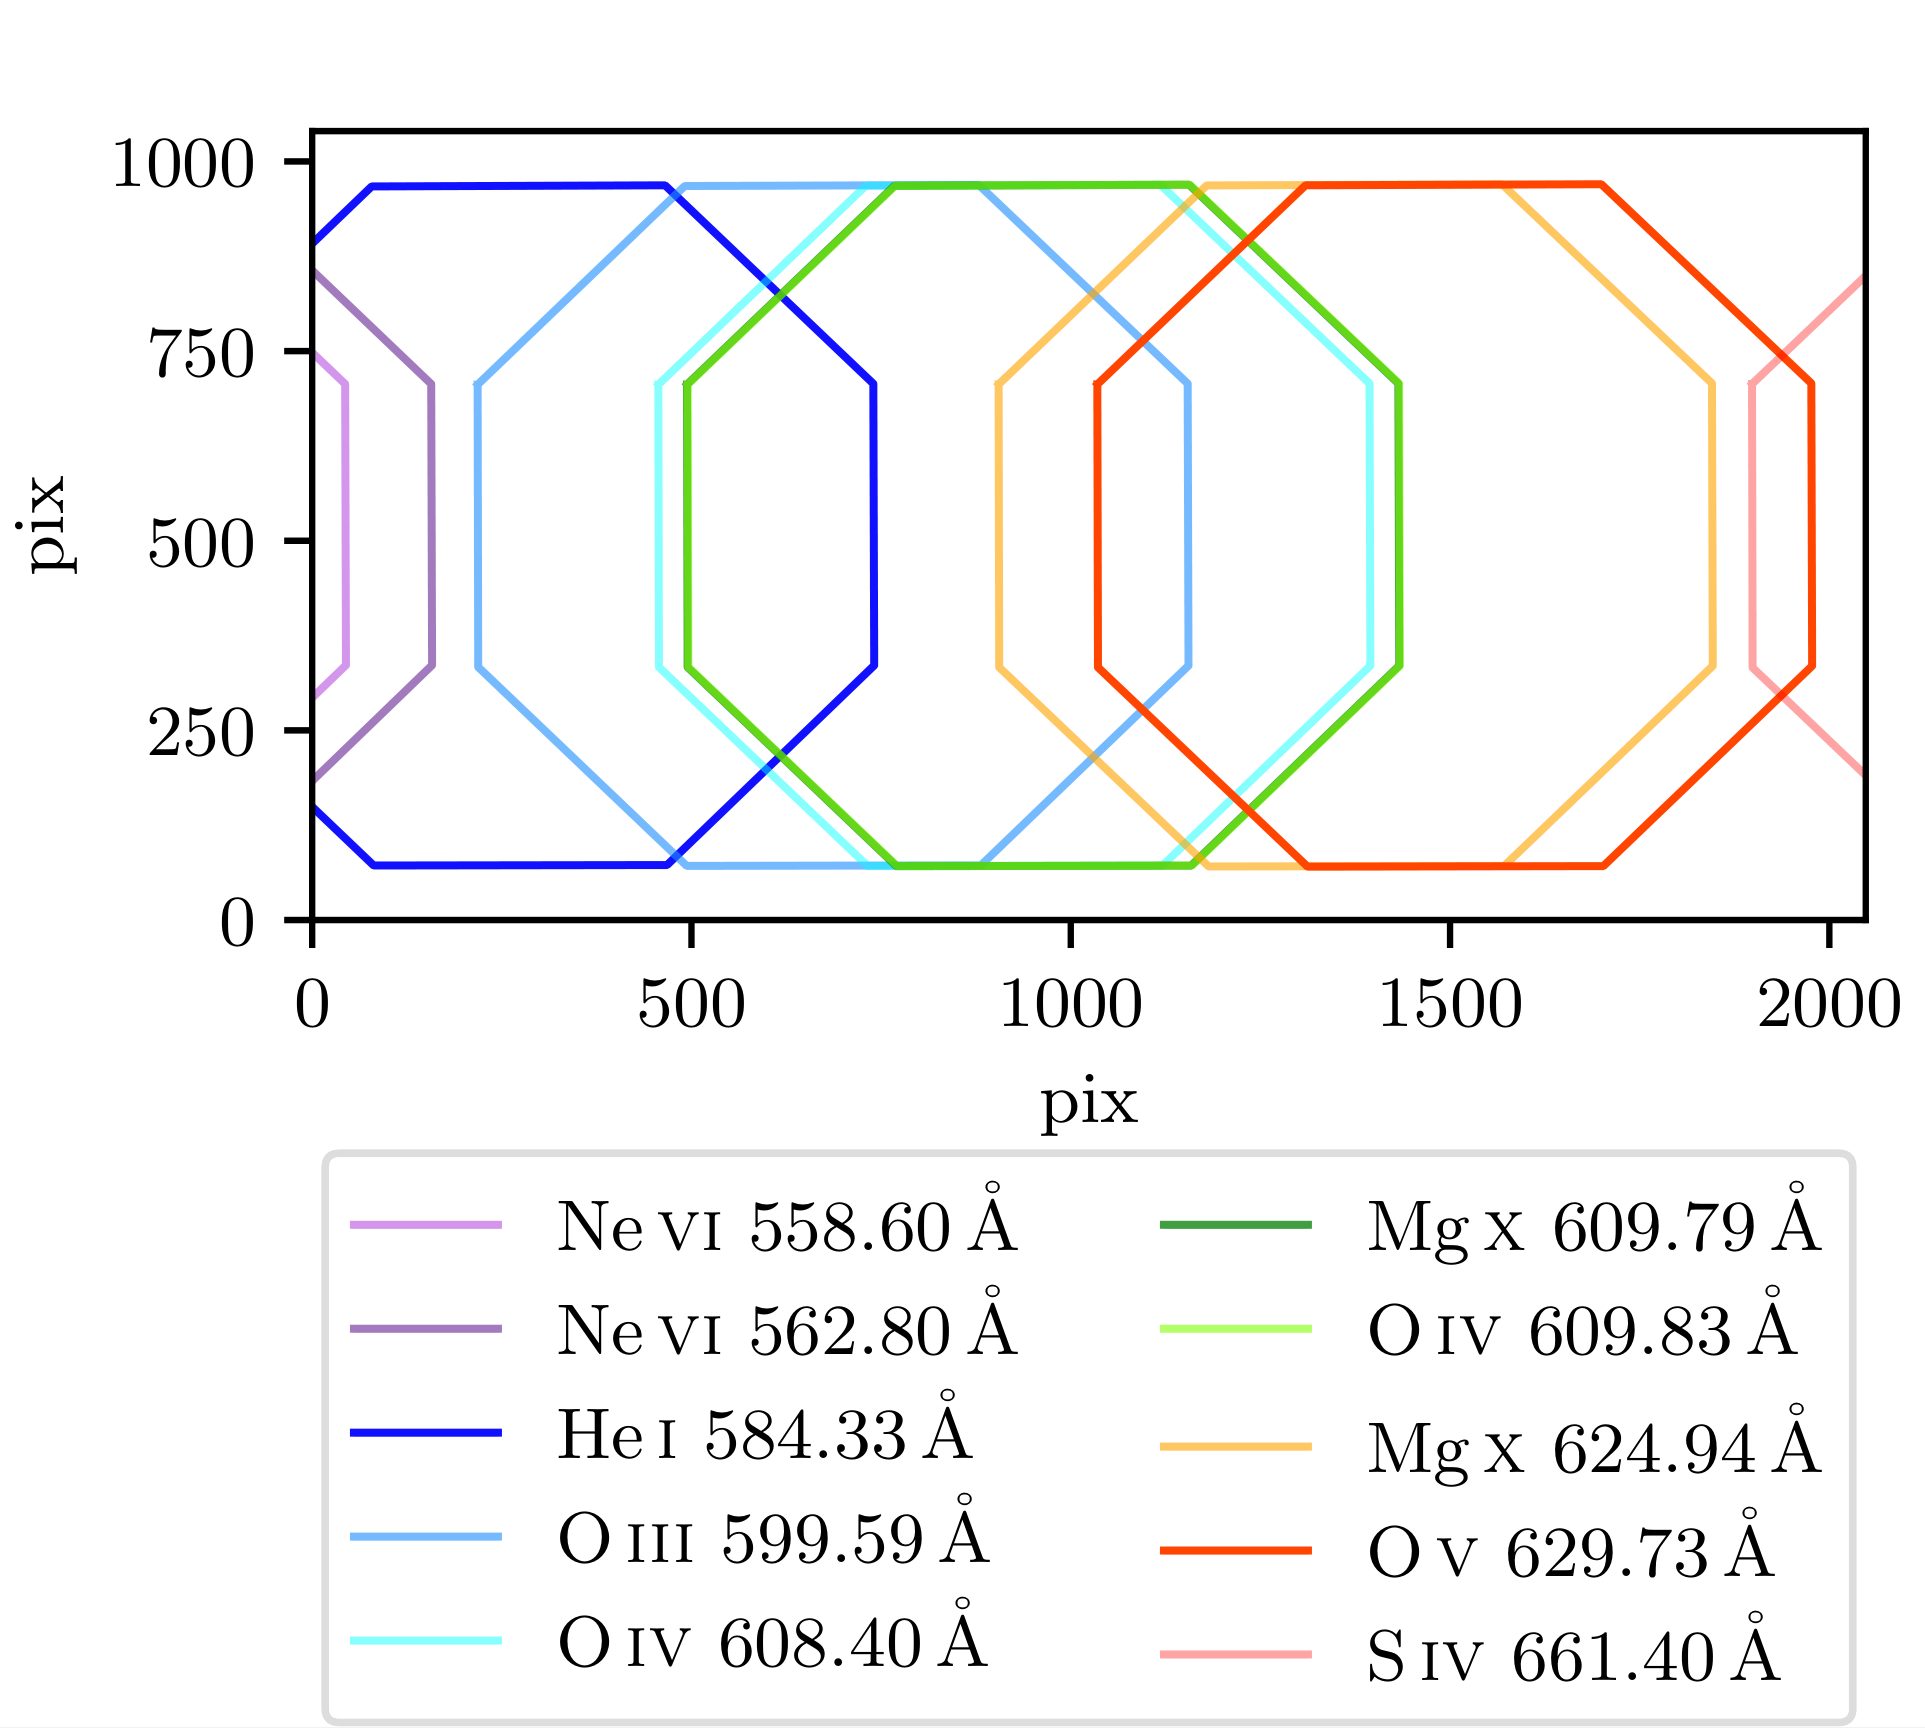
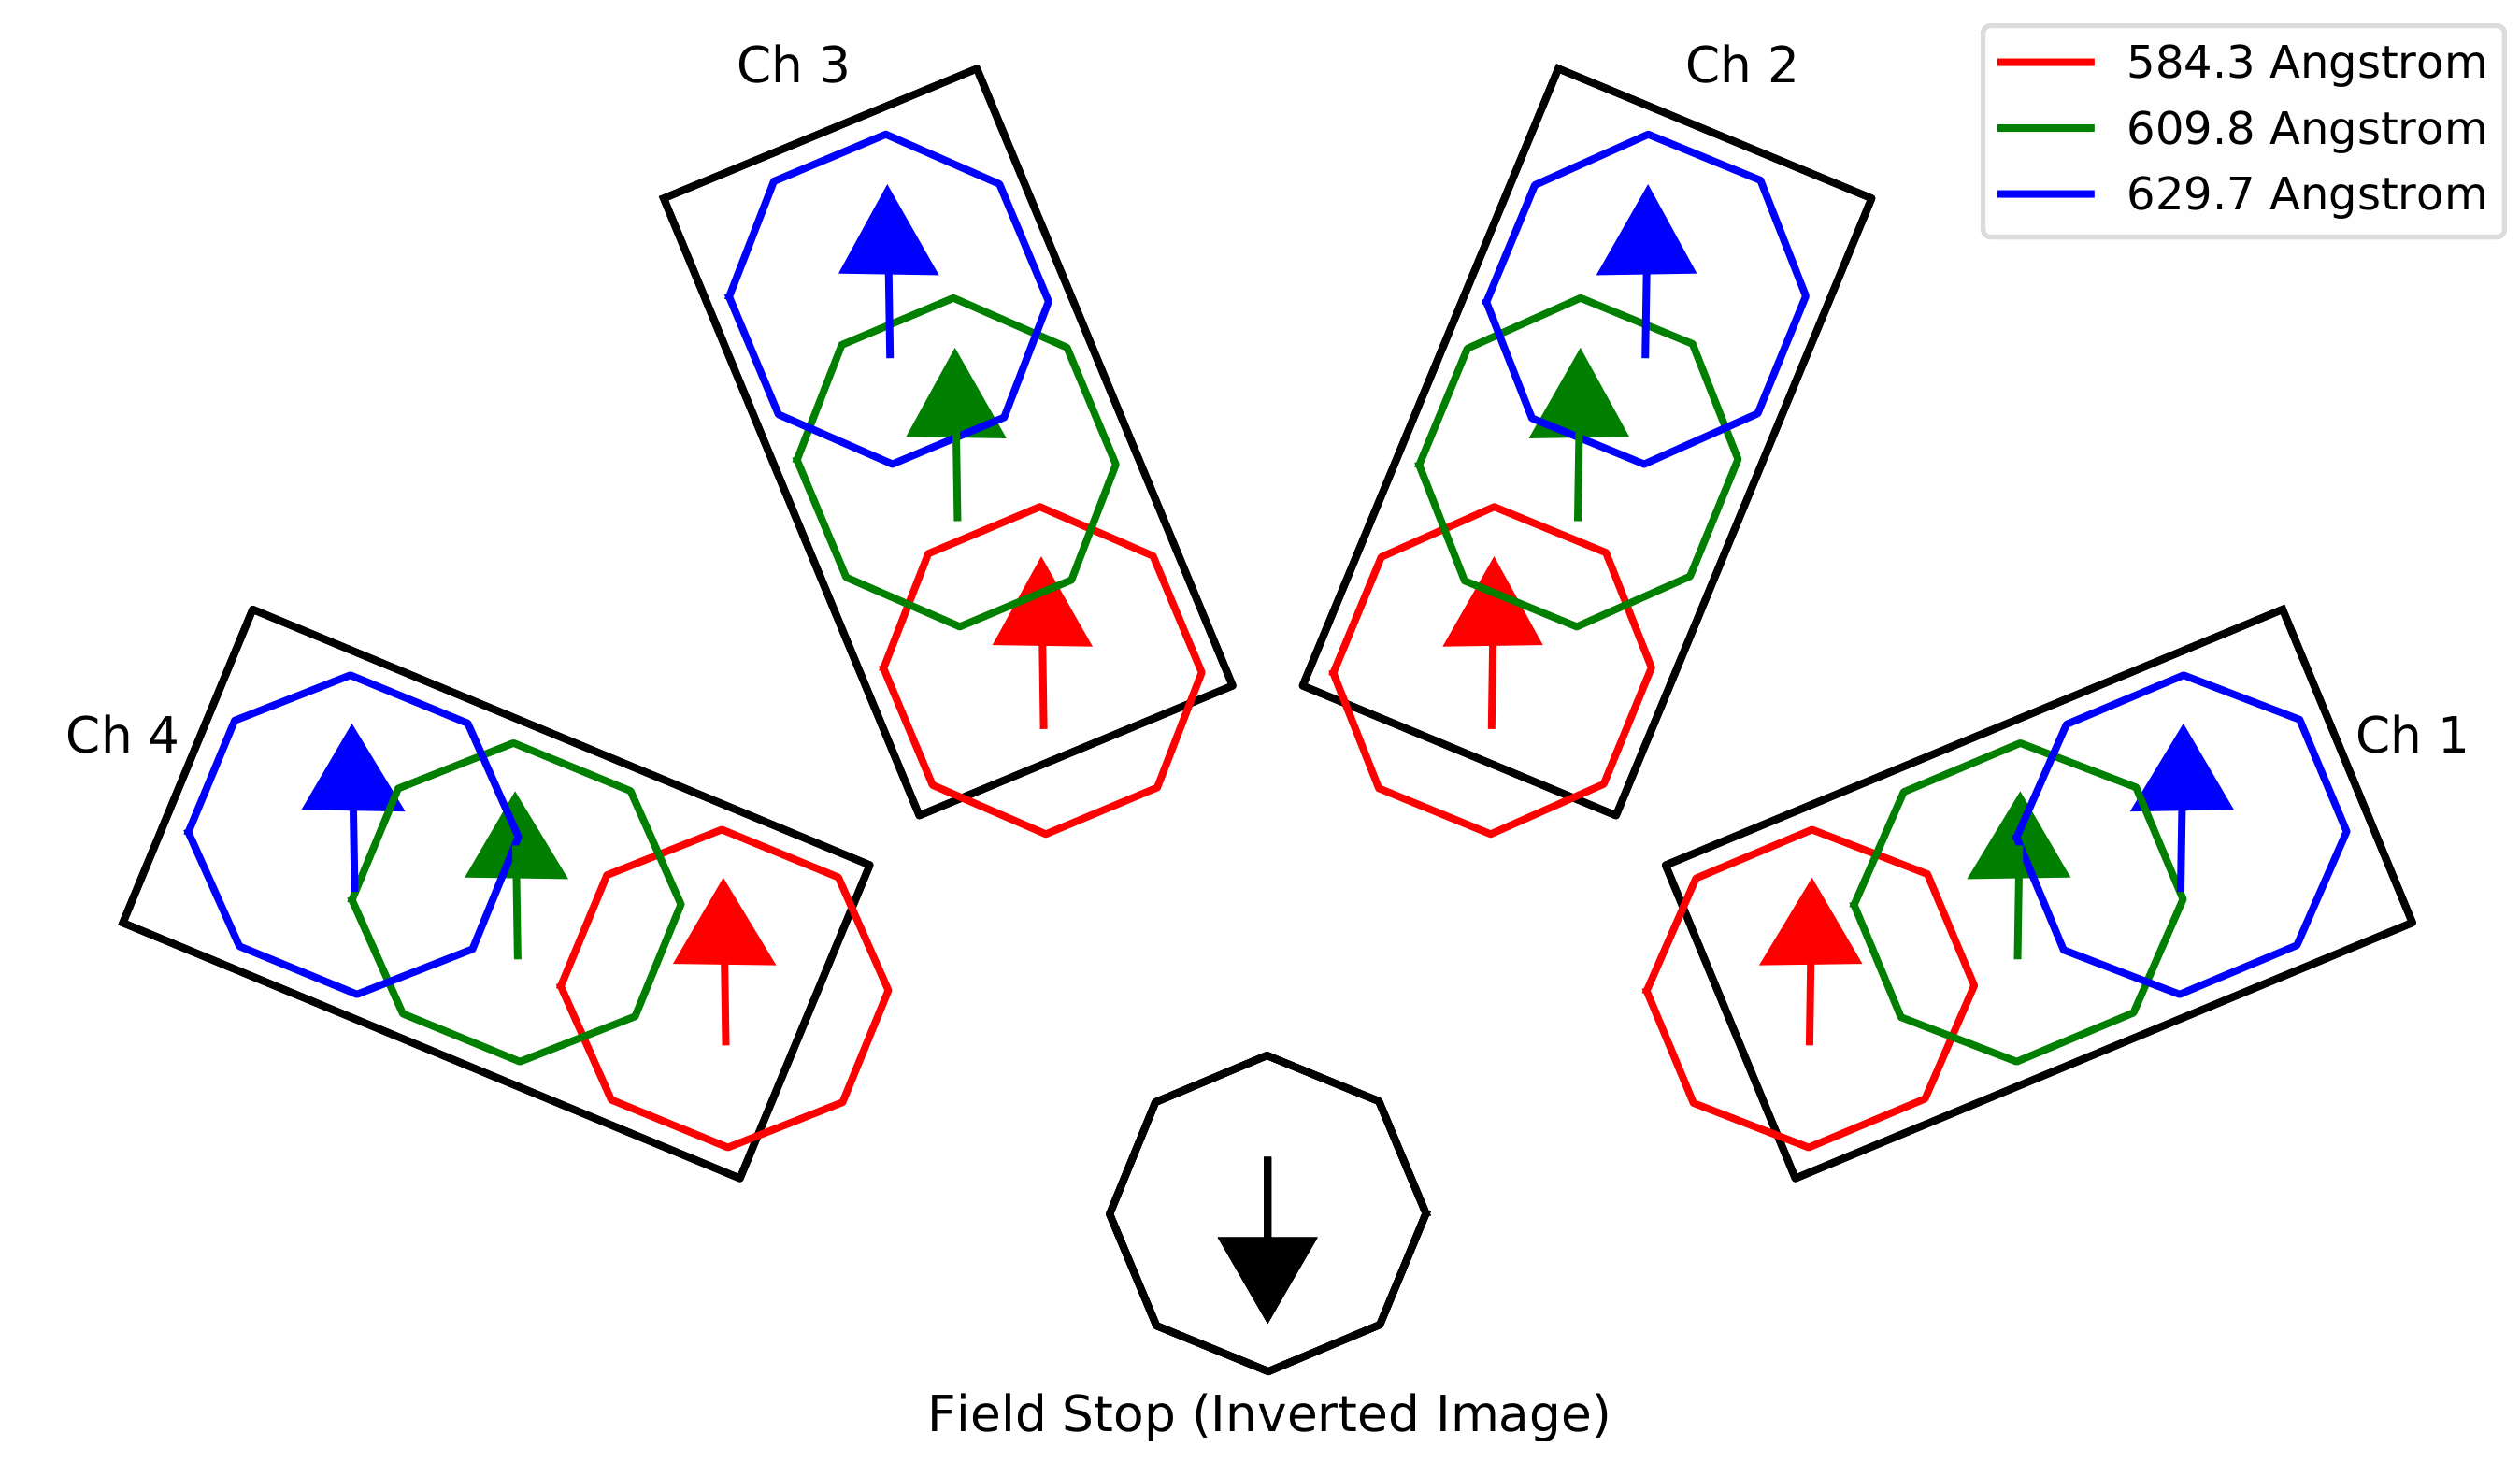
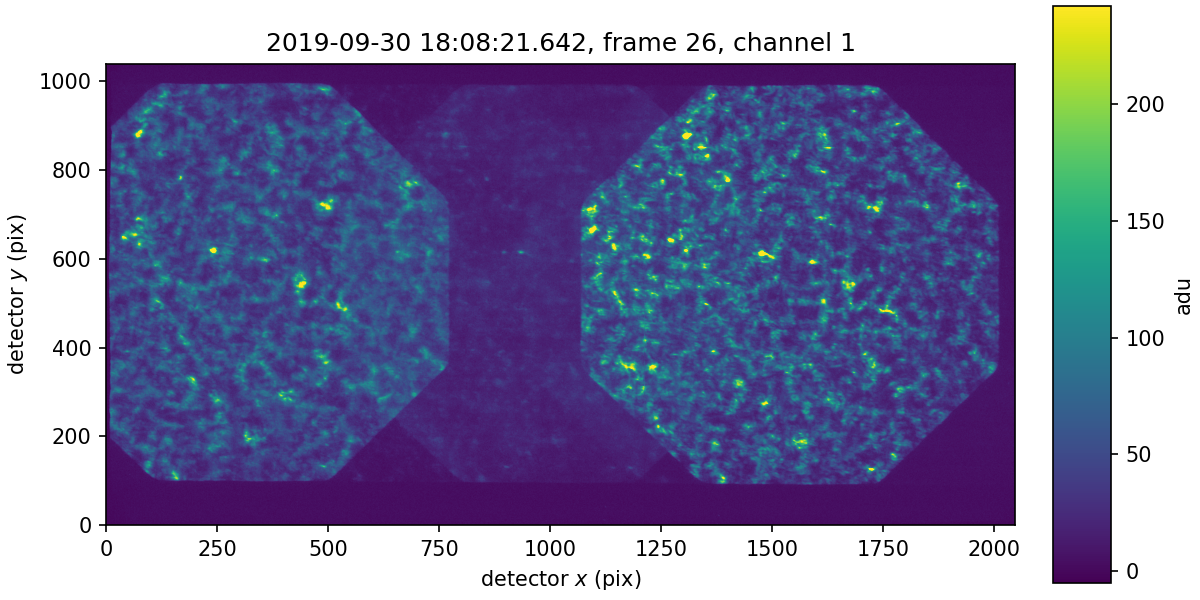
Computed Tomography Imaging Spectroscopy (CTIS) with ESIS
ESIS Inversions
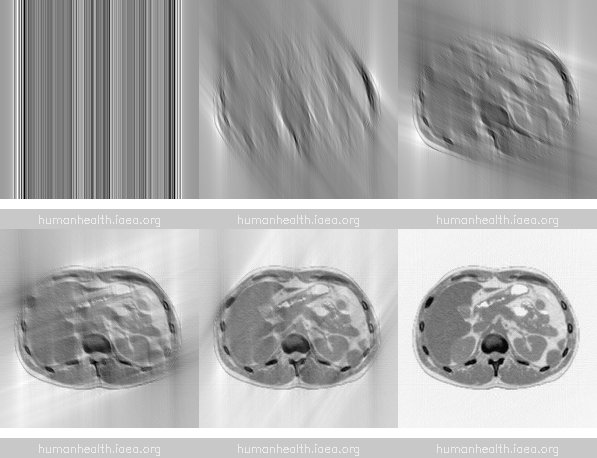
Analogue of a tomographic inversion problem
Spatial/spectral ambiguity
Limited number of angles
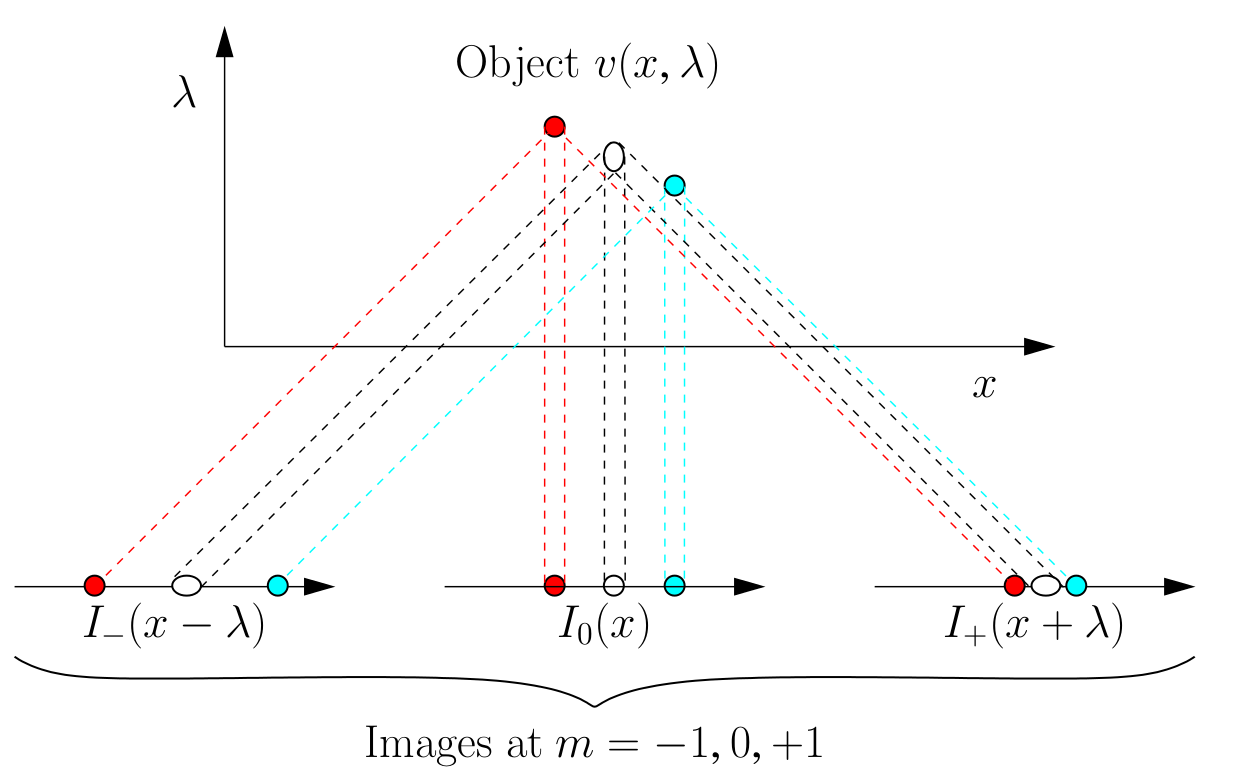
Convolutional Neural Network inversion technique
Training/validation dataset
IRIS Si IV 1394 A 320-step dense rasters
Rebinned to ESIS resolution
64 training / 17 validation examples
Network Architecture
Fully-convolutional network
2 convolutional + 2 deconvolutional layers
11x11x11 kernel size
32 filters per layer
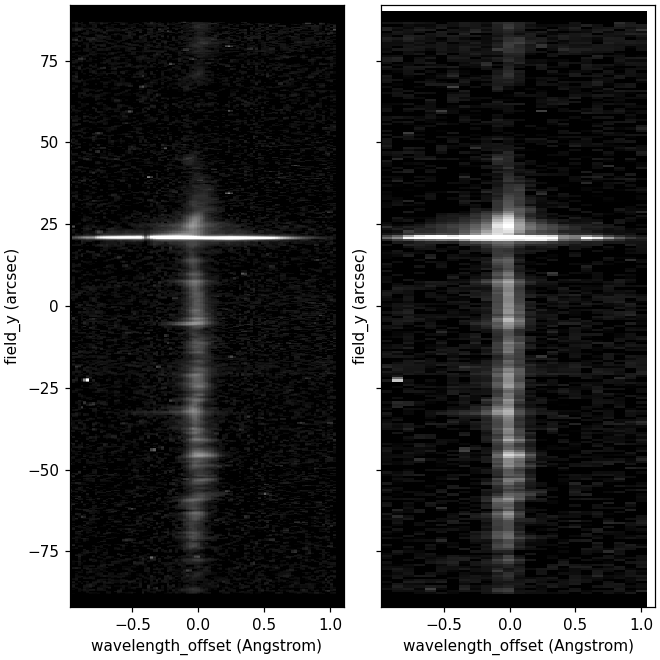
Left: Original IRIS spectrum (scaled to avg. O V width)
Right: IRIS spectrum rebinned to ESIS resolution
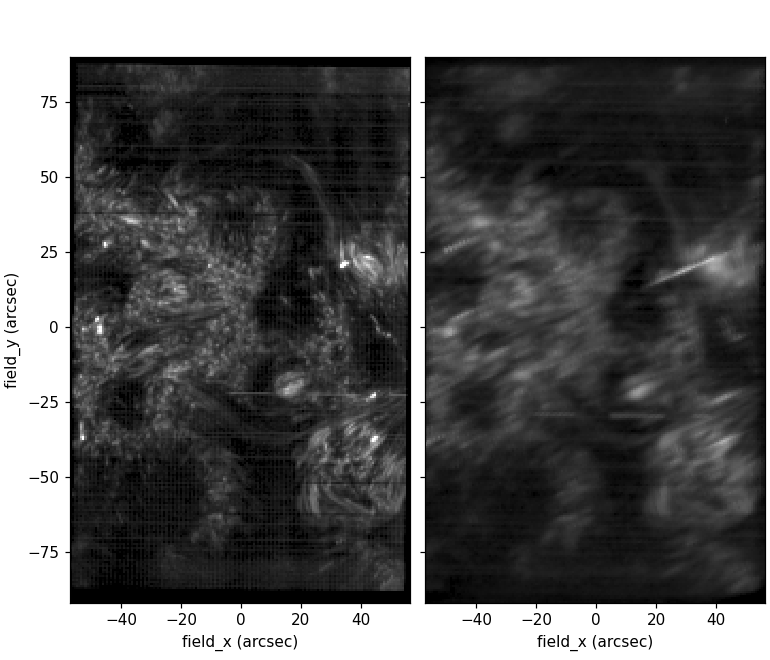
Left: Spectrally-integrated IRIS raster, rebinned to ESIS resolution (ground truth)
Right: Synthetic ESIS observation calculated from the original IRIS raster
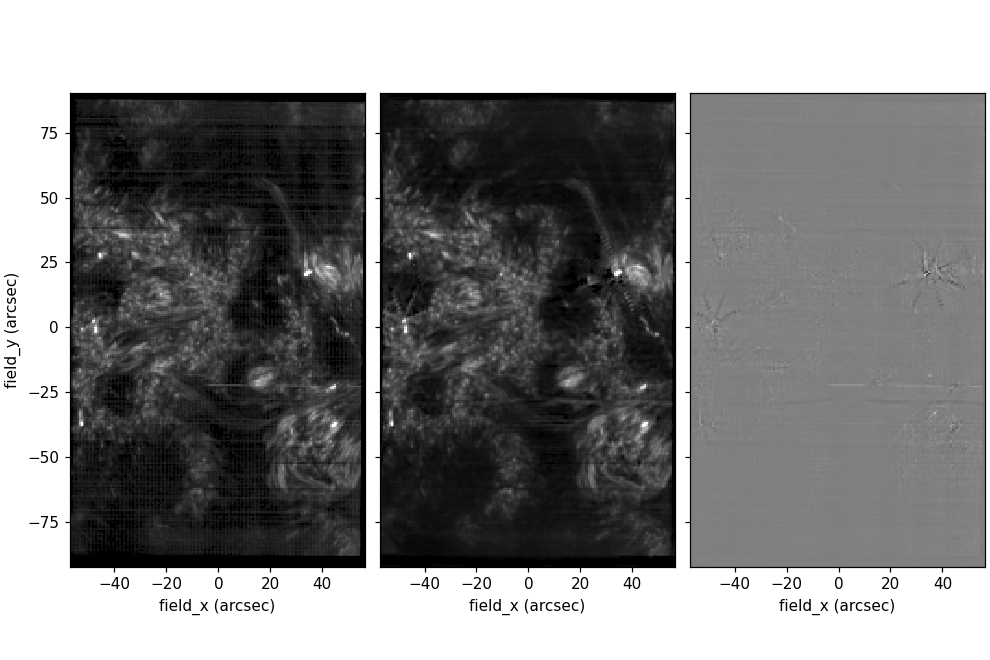
Ground truth (left), reconstructed (middle), difference (right)
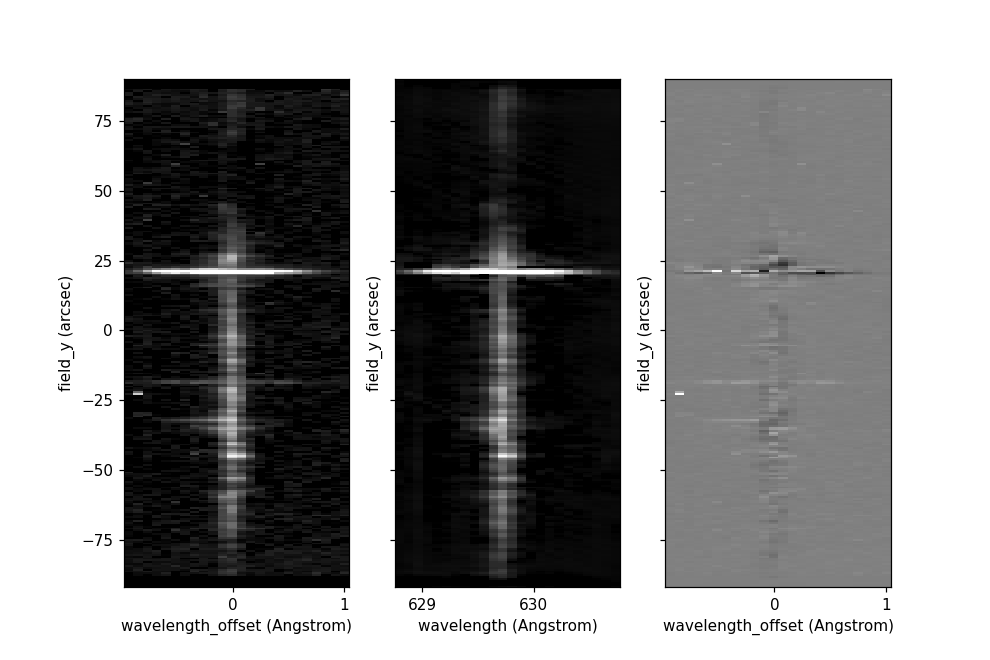
Ground truth (left), reconstructed (middle), difference (right)
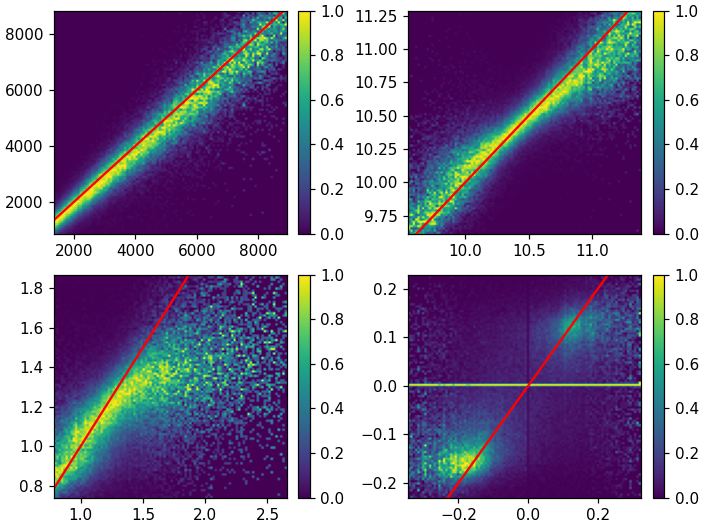
Left: first four true moments vs. reconstructed moments
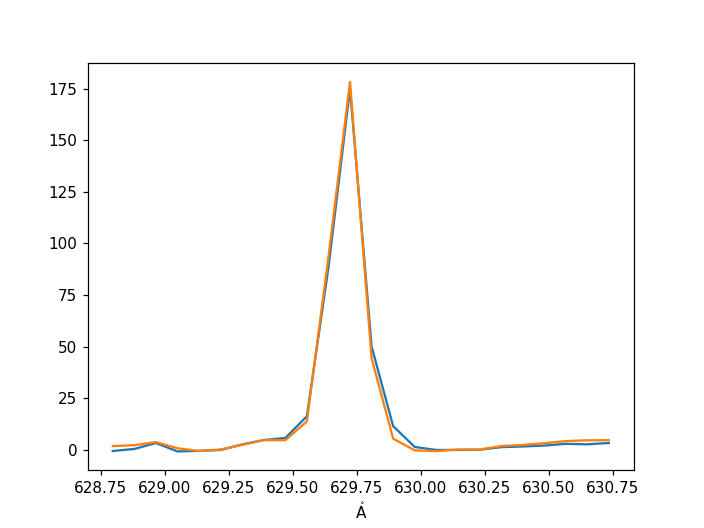
Right: Average validation spectrum (blue), average reconstructed spectrum (orange)