Machine Learning Techniques for Computed Tomography Imaging Spectroscopy of the Solar Atmosphere

AGU Fall Meeting · Washington, D.C. · December 11, 2018

Machine Learning Techniques for Computed Tomography Imaging Spectroscopy of the Solar Atmosphere

Roy T. Smart and Charles C. Kankelborg

roy.smart@montana.edu


December 11th 2018

AGU Fall Meeting

Washington D.C.


1 / 23

Hi everyone, thanks for joining me, today we will be talking about ‘Machine Learning Techniques for Computed Tomography Imaging Spectroscopy of the Solar Atmosphere’. This is work was done by me and my advisor Dr. Charles Kankelborg to improve the data analysis techniques for the CT imaging spectrographs developed by his research group.

Outline

Solar Explosive Events

Imaging Spectroscopy

Slit

Computed Tomography

MOSES

Description

Current inversion schemes

Neural network inversion

Description

Results


2 / 23

We will start by going over a quick outline of my talk today. I will quickly introduce solar explosive events, phenomena that can only be observed through the technique of imaging spectroscopy. We will then investigate how traditional slit imaging spectroscopy is inadequate for a complete picture of explosive events and how CT imaging spectroscopy can address the problems of slit imaging spectroscopy. Next we will investigate a particular CT imaging spectrograph, known as MOSES and demonstrate how the current analysis techniques can be improved. Finally, we will introduce a new analysis technique based on neural networks and discuss the performance of this new technique.

Solar Explosive Events

Transient intensity enhancement

Significant Doppler shift

Increased Doppler width

3 / 23

Solar explosive events are a wide class of events that are characterized by transient intensity enhancement, and significant Doppler shift and/or increased Doppler width. They occur over a wide range spatial scales and likely are due to various underlying physical phenomena. This example was captured by the Interface Region Imaging Spectrograph (IRIS) on July 21st 2013. This is a particularly dramatic explosive event that is connected to an eruption, and we will use it as an example in the remainder of the presentation.

Explosive Event Example

Expanding shell in three spatial dimensions

4 / 23

To understand how to interpret explosive events using imaging spectroscopy, I will use a cartoon firework as an example. This firework is a simple expanding spherical shell of randomly placed tracers in three dimensions x, y, and z.

Explosive Event Example

Can only observe as a projection onto the skyplane

5 / 23

When we observe explosive events from earth, the 3D event is projected onto the skyplane y, z. The result of this projection is shown in the bottom right.

Explosive Event Example

Each tracer has been blue/red-shifted relative to the skyplane

6 / 23

As we saw in the IRIS example, explosive events are characterized by a measurable Doppler shift. To demonstrate that, we can add colors to the tracers to indicate the observed wavelength of the tracers, or according to Doppler, the velocity relative to the skyplane.

Intro to Imaging Spectroscopy

The goal of imaging spectroscopy is to reconstruct a spatial-spectral (x,y,λ) cube.

7 / 23

With this picture in mind, we can then define another 3D object known as the spatial-spectral cube, shown in the top right, which has the two original skyplane dimensions and a new wavelength dimension. The goal of imaging spectroscopy is to measure this spatial-spectral cube, which allows us to reconstruct the original object on the top left.

Diffraction gratings

Nonzero spectral orders disperse different wavelengths of light at different angles.

This property is exploited to measure the spectral profile of any light source
M = 0

M = 1

M = -1

8 / 23

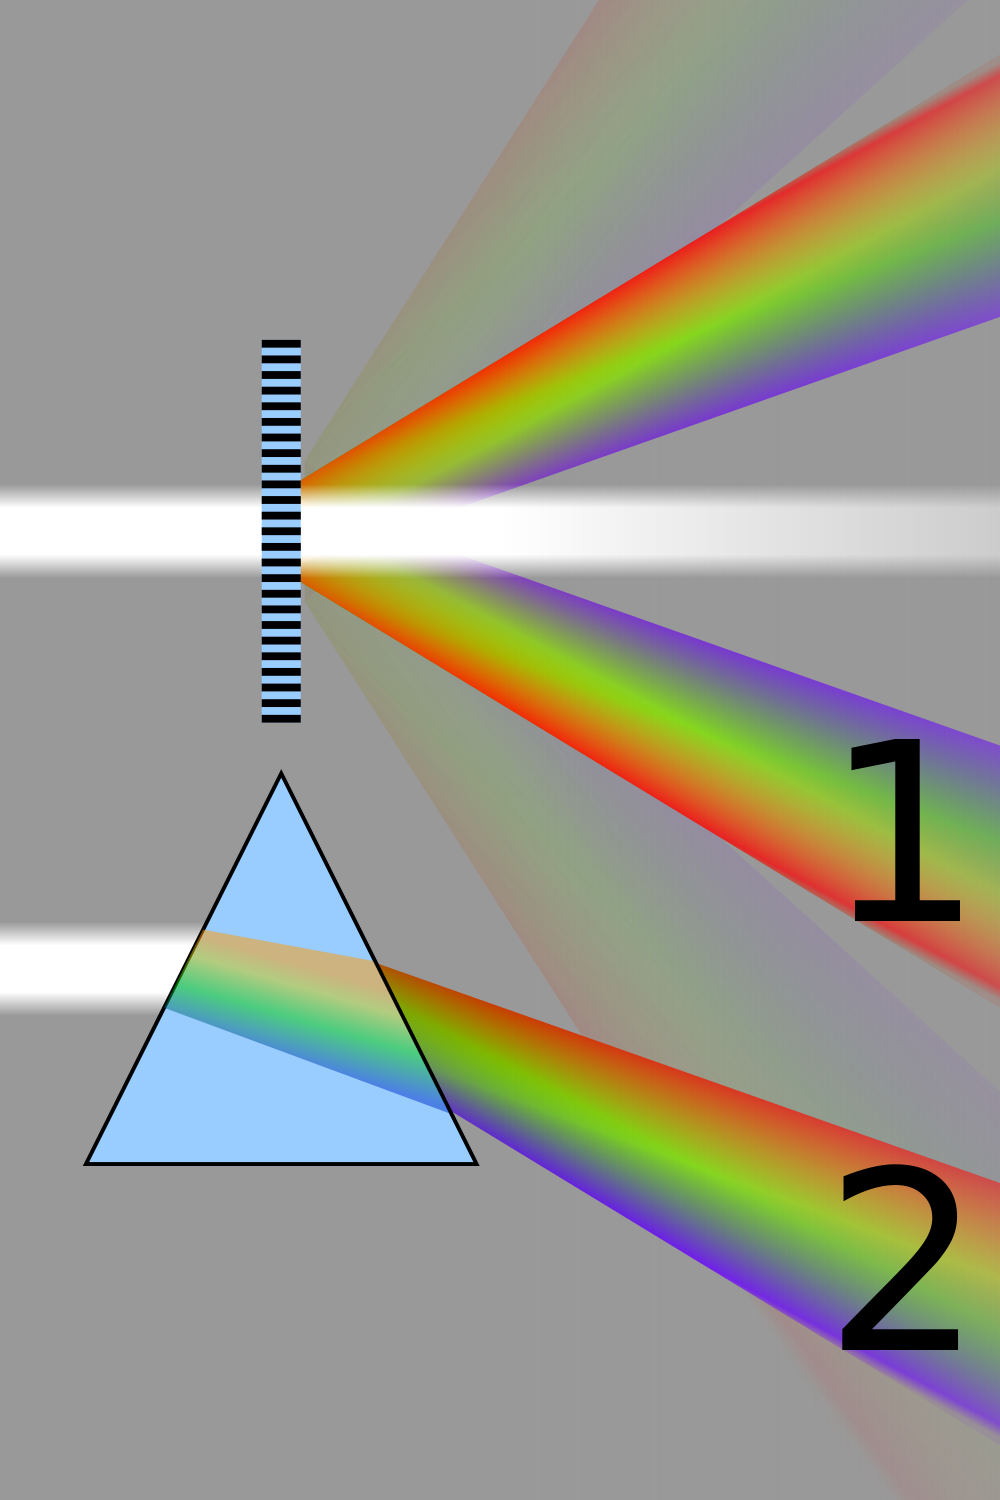
As I’m sure many of you are aware, diffraction gratings split light into many spectral orders and the nonzero spectral orders disperse long wavelengths more than short wavelengths. We can take advantage of this property to construct spectrographs, where different wavelengths of light are focused onto different parts of a detector and allow us to measure a spectral profile of a light source.

Intro to Imaging Spectroscopy

Imaging the spatial-spectral cube at a nonzero spectral order is equivalent to an angled projection through the cube.

Space and wavelength become confused (overlappogram).

9 / 23

In terms of the spatial-spectral cube, imaging the m=0 spectral order is simply the skyplane image of the cube (bottom center). However imaging the nonzero spectral orders can be represented as projections at some angle through the spatial-spectral cube, where the angle depends on the dispersion of a particular grating. This can be seen in the bottom right figure. In this figure we can notice that space and wavelength become convolved together, making such an image difficult to interpret accurately.

Slit Imaging Spectroscopy

Eliminate space/wavelength confusion by restricting field-of-view.

Only part of the event can be captured.

10 / 23

One common way to resolve the ambiguity between space and wavelength can be resolved by using a slit spectrograph such as IRIS. In this design, the field-of-view along the ambiguous axis is restricted to a small area, allowing the imagery on the detector to be interpreted as only wavelength. This method is an effective way of precisely measuring the spectrum of an object, however it has the obvious disadvantage that it can only observe a small portion of an event at any one time. We can see in our example that rastering the slit across the event immediately makes interpretation of the original object difficult.

Computed Tomography Imaging Spectroscopy

No slit, wide field-of-view

Image spatial-spectral cube at several diffraction orders

Use computed tomography algorithms to recover the cube.

Ill-posed inversion problem

11 / 23

To address the problems with slit spectroscopy, there has been significant development in a field known as CT imaging spectroscopy, or slitless imaging spectroscopy. In this technique the spatial-spectral cube is imaged in several diffraction orders to produce several corresponding overlappogram images. Since each image is a projection through a 3D space, inverting these images back into the spatial-spectral cube can be reduced to a computed tomography problem. This is a well-studied problem, especially in the medical field where constructing 3D volumes from many 2D images is a common technique in instruments such as magnetic resonance imagers. However inversions for CT imaging spectroscopy is often more difficult, since the number of angles is often very limited, usually between 2-6 projection angles. Since a useful spatial-spectral cube contains more information than 2-6 images, this is known as an ill-posed inversion problem. The remainder of this presentation will discuss strategies to solve this ill-posed problem.

MOSES

Multi-Order Solar EUV Spectrograph

CT imaging spectrograph designed to resolve single emission line

Three projection angles

Dispersion in only one plane means that the 3D CT problem can be reduced to a 2D problem.

Two successful flights

2006 – He II 304A

2015 – Ne VII 465A

12 / 23

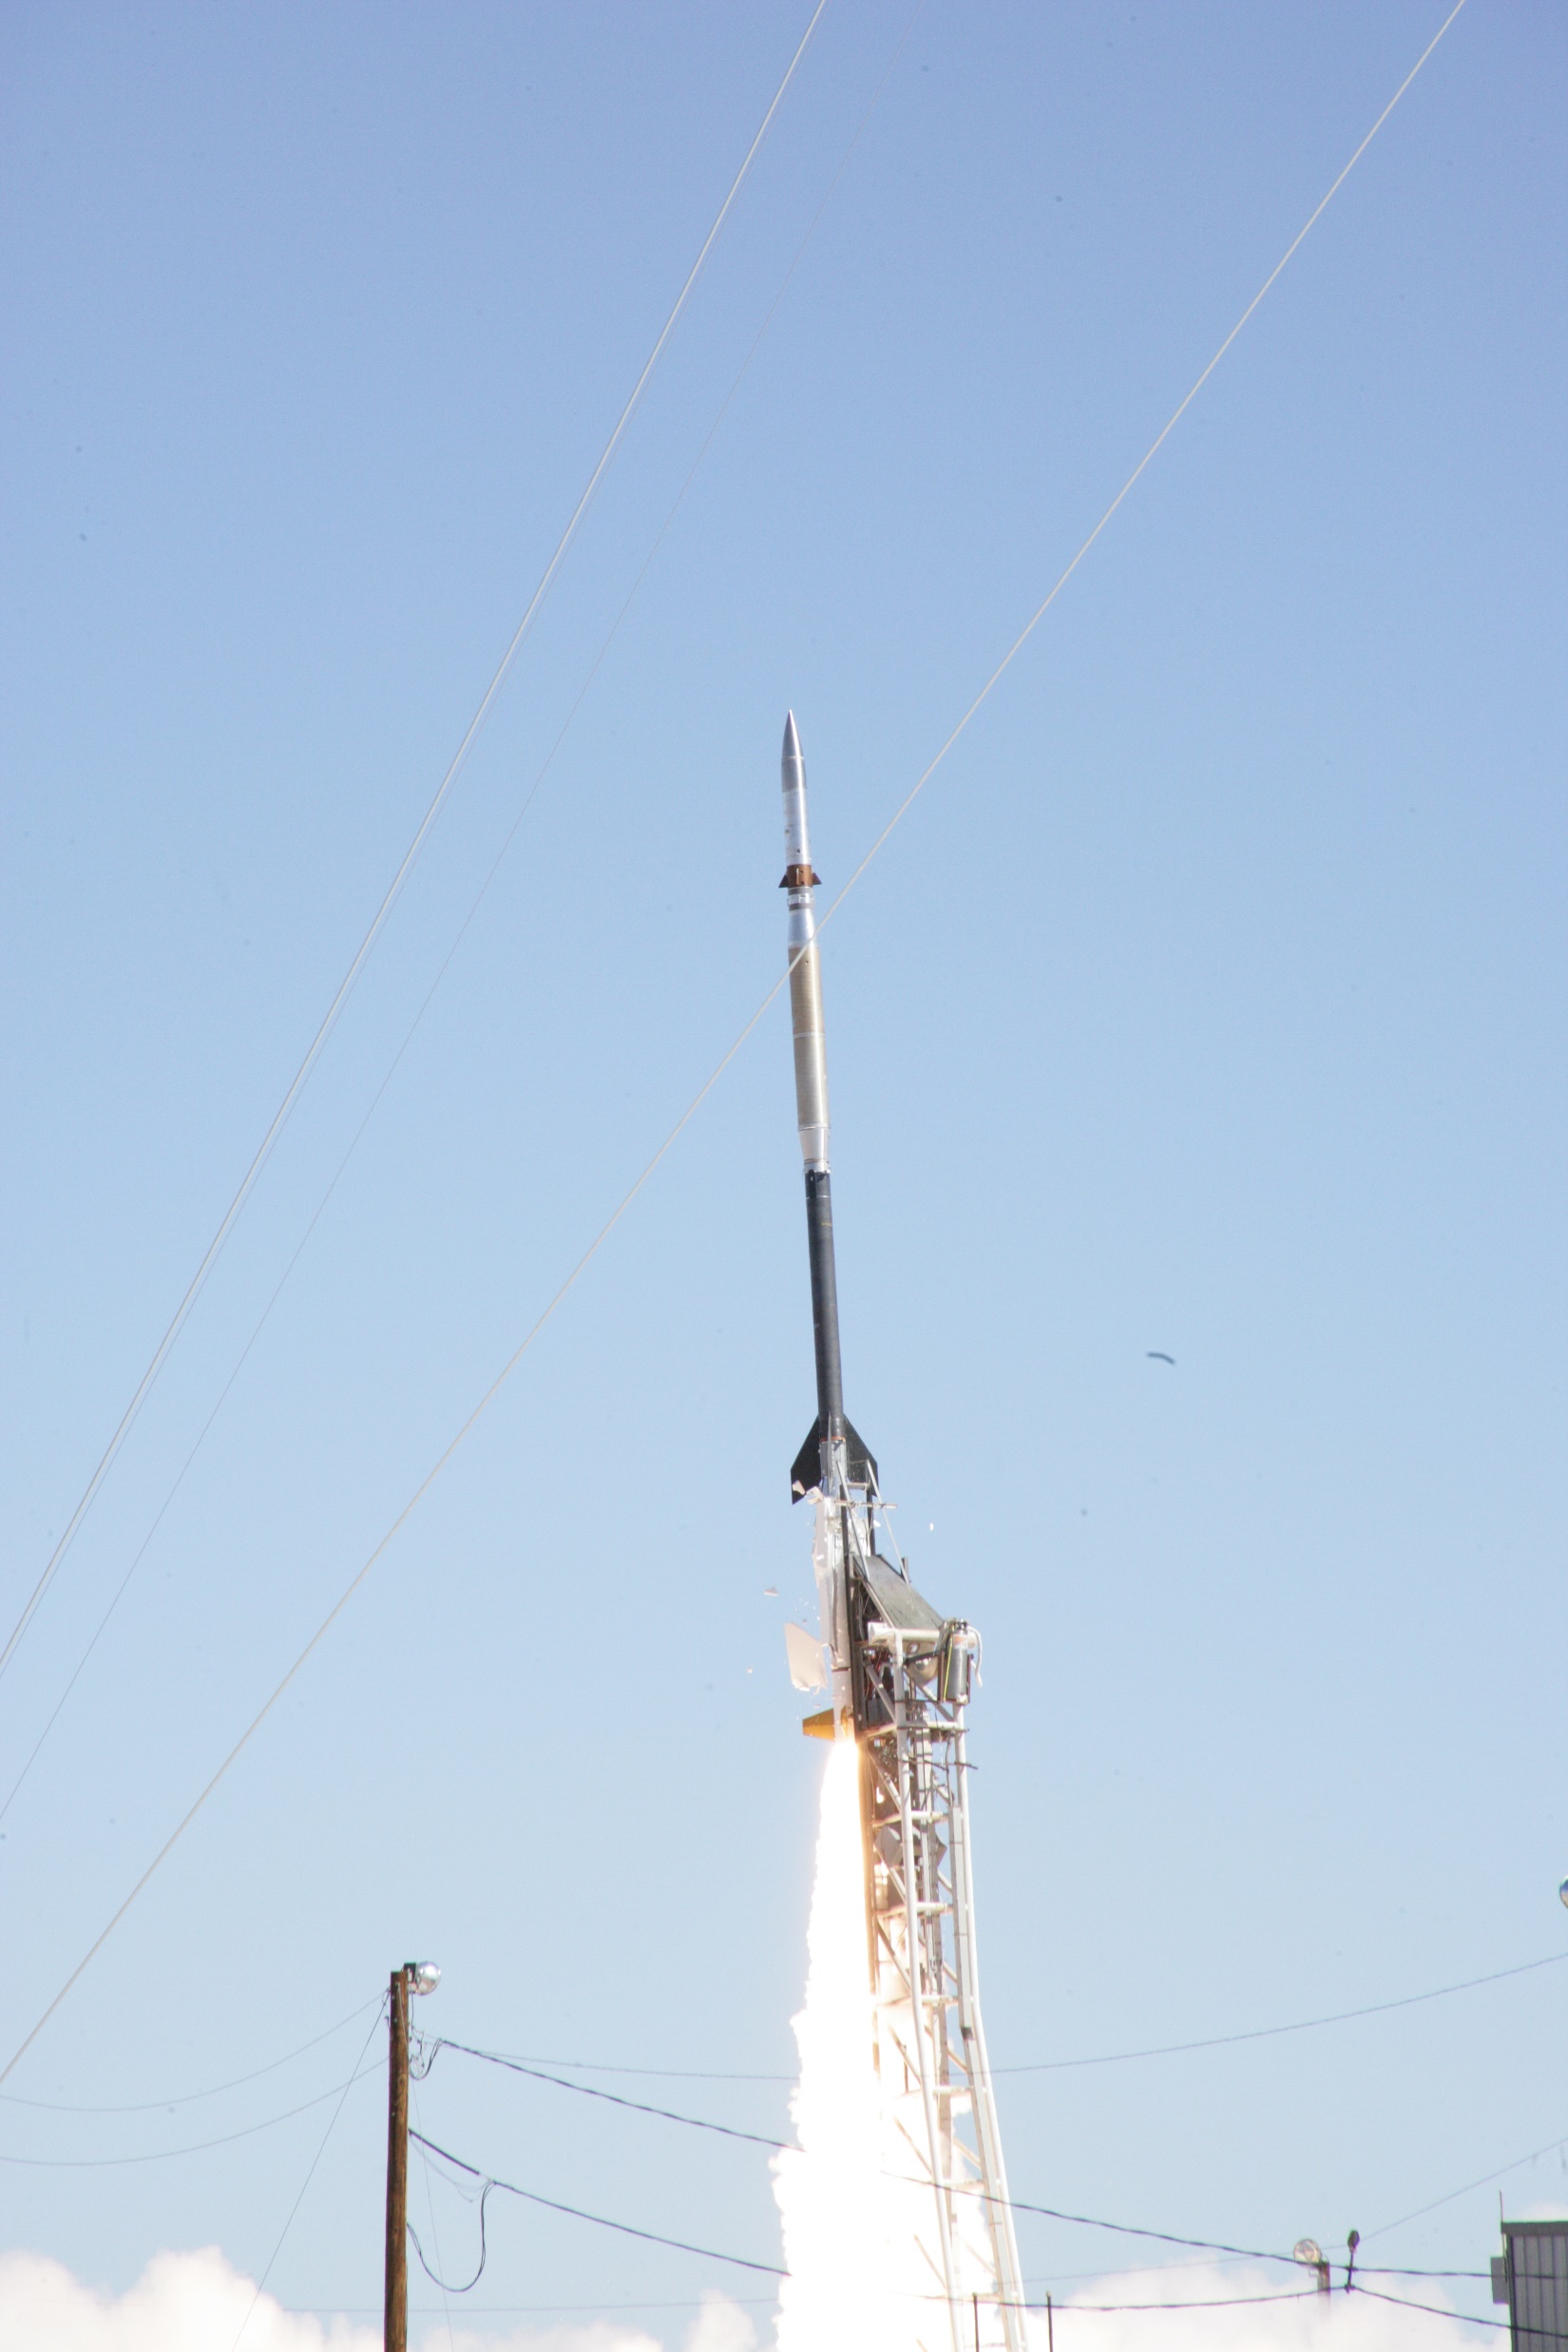
The Multi-order solar EUV Spectrograph is an example of a CT imaging spectrograph developed by our research group. This instrument is designed to mitigate the ill-posed inversion problem by using a narrow passband filter to target a single spectral line. It images this target line in three spectral orders m = -1, 0 and 1 just like in our firework example. This instrument has undergone two iterations, the first, which flew in 2006, imaged the He II 304A spectral line, and the second imaged the Ne VII 465 A spectral line and flew in 2015. The data from the 2015 flight is not as clean as the 2006 flight, so we will focus on the 2006 flight for the remainder of this presentation. Also like in our firework example, the dispersion is limited to one plane. Since the dispersion is invariant along the z axis, we are free to reduce the original 3D inversion problem to a 2D inversion problem.

Synthetic MOSES Observations

Inverting MOSES observations is a 2D CT problem.

We can use data from a slit spectrograph as a synthetic sun.

IRIS Si IV 1394

Sum along columns and diagonals to construct projections.


13 / 23

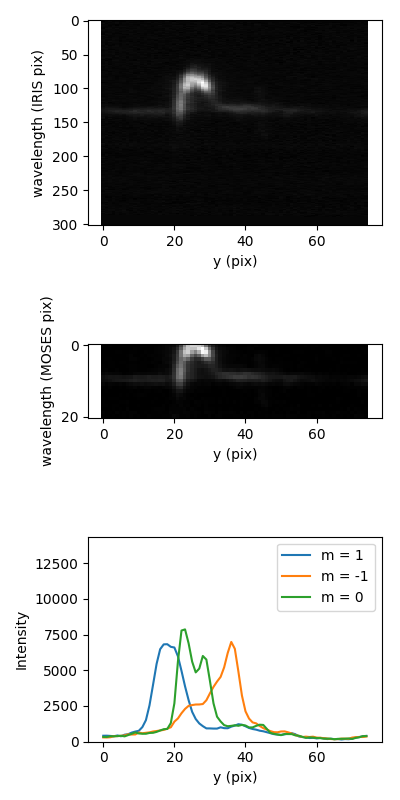
This ability to reduce MOSES observations to a 2D inversion problem is very convenient because it means that we can use data from slit spectrographs such as IRIS as a synthetic sun to test our inversion schemes. An emission line observed by IRIS that is the closest approximation to the He II line observed by MOSES is probably one of the Si IV lines. For this work we chose the 1394 A line since it has the best signal out of the two Si IV lines. Making a synthetic MOSES observation out of these IRIS observations is very simple, we start by trimming and downsampling the image into the MOSES spectral resolution and range and then we can simply sum along the spectral axis and along the two diagonals. Since we reduced the dimensionality of the problem, the result is a set of three lines instead of three images.

Current MOSES Inversion Scheme

Multiplicative Algebraic Reconstruction Technique (MART)

Minimal assumptions

Positivity

Iterative reconstruction technique

SSC Initial guess

Apply projections

Compare projections to measurement

Multiply guess by correction factor

14 / 23

Current inversion schemes for MOSES are based on algebraic reconstruction techniques, a common method in computed tomography. This algorithm only assumes that the result must be positive (as intensity should be). It is an iterative reconstruction technique that starts with some initial guess at the spatial-spectral cube, computes the corresponding MOSES observations by applying projections, compares the projections to the measurement, and then multiplies the guess by some correction factor to bring the projections closer to the measurement. This process continues until convergence is reached.

MART Inversion Test

Plaid

Intensity is spread along projection directions

Line parameters

Excellent intensity match (as expected!)

Overestimate shift at line center (plaid)

Overestimate width (plaid)

15 / 23

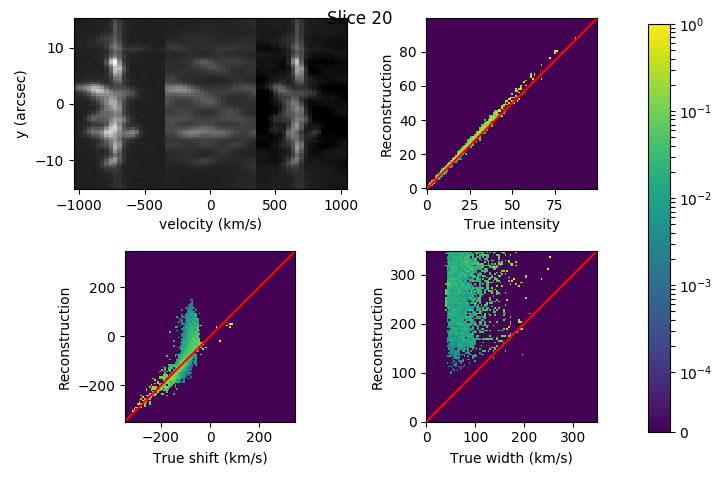
On the top left we can see an animation of the algorithm’s progress on inverting the spatial-spectral cube. We can immediately notice that the algorithm tends to create artifacts that we have dubbed plaid, where intensity is smeared along the projection direction. This is an artifact that is ubiquitous in limited-angle inversion algorithms and it plays havoc with our ability to extract meaningful line parameters from the inversions. We can see this problem in the remaining three plots: intensity, shift and width. The intensity is correct as it should be since we were iterating to correct for this quantity, however the shift both the shift and width are overestimated due to the plaid artifacts.

Improving MOSES Inversions

Need a method to resistant to plaid

One possibility is to use information from other solar observatories such as IRIS to constrain inversions.

This is an example of machine learning
16 / 23

On the top left we can see an animation of the algorithm’s progress on inverting the spatial-spectral cube. We can immediately notice that the algorithm tends to create artifacts that we have dubbed plaid, where intensity is smeared along the projection direction. This is an artifact that is ubiquitous in limited-angle inversion algorithms and it plays havoc with our ability to extract meaningful line parameters from the inversions. We can see this problem in the remaining three plots: intensity, shift and width. The intensity is correct as it should be since we were iterating to correct for this quantity, however the shift both the shift and width are overestimated due to the plaid artifacts.
Introduction to Neural Networks

Algorithm to find relationship between inputs and outputs.

Represent relationship using network of activation functions with free parameters known as weights.

Weights determined through training where the network is presented many examples of input/output pairs

17 / 23

Applying Neural Networks to MOSES

Useful for the MOSES inversion problem since we already know how to generate input/output pairs.

IRIS Si IV 1394A will again be used as a proxy for He II 304A

1800 IRIS frames from Early 2013

Gather IRIS images

Despike IRIS images

Apply projections

Apply neural network to projections

Compare to IRIS images

Adjust parameters of neural network

18 / 23

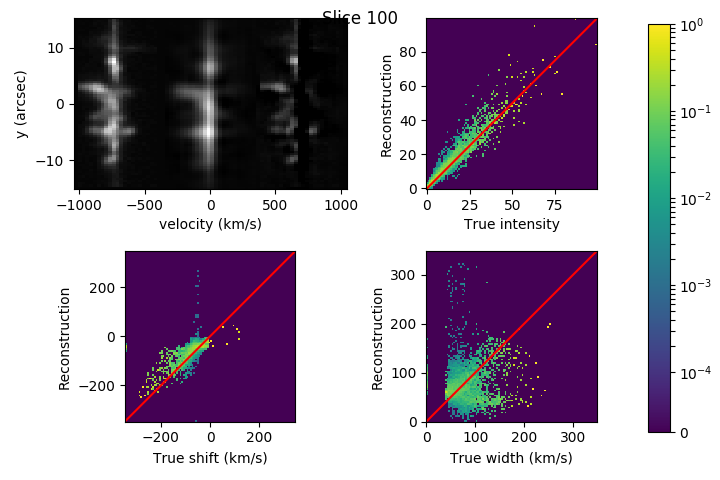
Neural Network Inversion Test

Plaid artifacts are heavily suppressed

Intensity reconstruction not as accurate

Reasonable reconstruction of the Doppler shift

Doppler width still imprecise.


19 / 23

Neural Network Inversion Test

Plaid artifacts are heavily suppressed

Intensity reconstruction not as accurate

Reasonable reconstruction of the Doppler shift

Doppler width still imprecise.


20 / 23

Comparing MART to Neural Networks

Original

MART

Neural Network

21 / 23

Summary

Imaging spectroscopy is an important tool for understanding the dynamics of the solar atmosphere

Slit spectrographs make interpretation of explosive events difficult.

CT imaging spectrographs are a promising technique to better understand explosive events.

Neural networks are an effective technique for generating realistic inversions.

22 / 23

Acknowledgements

23 / 23